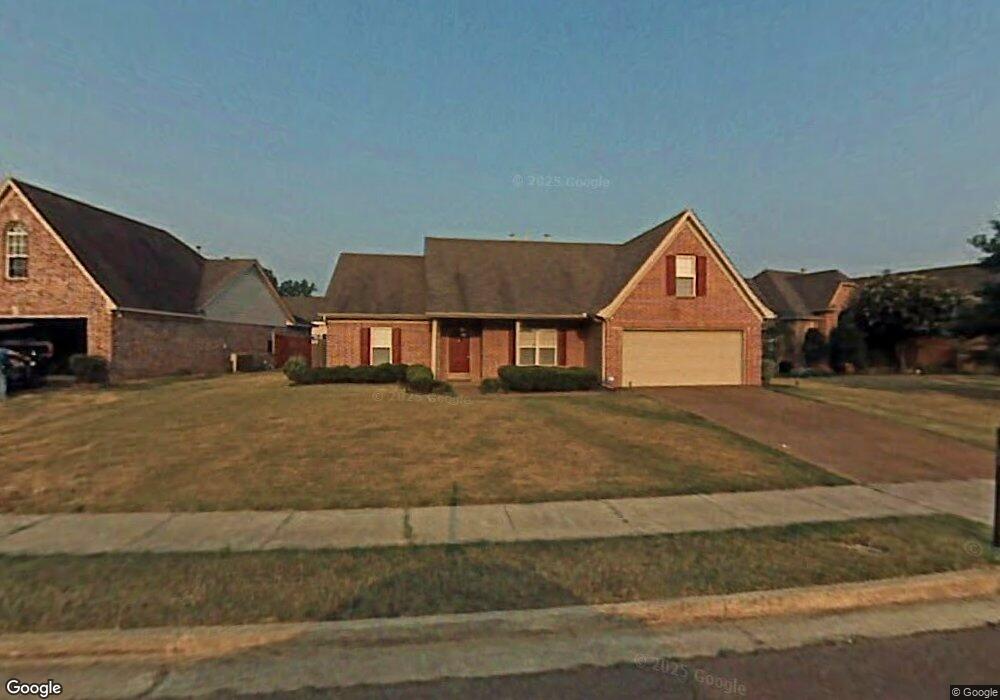
4993 Wolfchase Farms Pkwy Arlington, TN 38002
Estimated Value: $324,000 - $328,000
3
Beds
3
Baths
2,184
Sq Ft
$149/Sq Ft
Est. Value
About This Home
This home is located at 4993 Wolfchase Farms Pkwy, Arlington, TN 38002 and is currently estimated at $325,407, approximately $148 per square foot. 4993 Wolfchase Farms Pkwy is a home located in Shelby County with nearby schools including Rivercrest Elementary School, Bon Lin Middle School, and Bartlett High School.
Ownership History
Date
Name
Owned For
Owner Type
Purchase Details
Closed on
Oct 3, 2022
Sold by
Chamberlain Philip C
Bought by
Philip C Chamberlain Ii Investment Services T
Current Estimated Value
Purchase Details
Closed on
Aug 22, 2022
Sold by
Dogwood Properties Llc
Bought by
Chamberlain Philip C
Purchase Details
Closed on
Oct 15, 2007
Sold by
Old Forest Properties Gp
Bought by
Dogwood Properties Llc
Purchase Details
Closed on
Dec 3, 2004
Sold by
Lash Thuong L and Benskin Thuong L Lash
Bought by
Old Forest Properties Llc
Home Financials for this Owner
Home Financials are based on the most recent Mortgage that was taken out on this home.
Original Mortgage
$171,000
Interest Rate
4%
Mortgage Type
Unknown
Purchase Details
Closed on
Feb 24, 2003
Sold by
Lash James M
Bought by
Lash Thuong L
Purchase Details
Closed on
May 15, 2000
Sold by
Bryce Homes
Bought by
Lash James M and Lash Thuong L
Home Financials for this Owner
Home Financials are based on the most recent Mortgage that was taken out on this home.
Original Mortgage
$174,997
Interest Rate
8.25%
Mortgage Type
VA
Create a Home Valuation Report for This Property
The Home Valuation Report is an in-depth analysis detailing your home's value as well as a comparison with similar homes in the area
Home Values in the Area
Average Home Value in this Area
Purchase History
| Date | Buyer | Sale Price | Title Company |
|---|---|---|---|
| Philip C Chamberlain Ii Investment Services T | -- | -- | |
| Chamberlain Philip C | -- | Commercial Title Group | |
| Dogwood Properties Llc | -- | None Available | |
| Old Forest Properties Llc | $163,000 | -- | |
| Lash Thuong L | -- | -- | |
| Lash James M | $169,900 | Security Title |
Source: Public Records
Mortgage History
| Date | Status | Borrower | Loan Amount |
|---|---|---|---|
| Previous Owner | Old Forest Properties Llc | $171,000 | |
| Previous Owner | Lash James M | $174,997 |
Source: Public Records
Tax History Compared to Growth
Tax History
| Year | Tax Paid | Tax Assessment Tax Assessment Total Assessment is a certain percentage of the fair market value that is determined by local assessors to be the total taxable value of land and additions on the property. | Land | Improvement |
|---|---|---|---|---|
| 2025 | -- | $81,300 | $16,650 | $64,650 |
| 2024 | -- | $56,075 | $11,100 | $44,975 |
| 2023 | $2,871 | $56,075 | $11,100 | $44,975 |
| 2022 | $1,901 | $56,075 | $11,100 | $44,975 |
| 2021 | $1,935 | $56,075 | $11,100 | $44,975 |
| 2020 | $2,409 | $40,975 | $10,175 | $30,800 |
| 2019 | $750 | $40,975 | $10,175 | $30,800 |
| 2018 | $1,659 | $40,975 | $10,175 | $30,800 |
| 2017 | $2,434 | $40,975 | $10,175 | $30,800 |
| 2016 | $1,691 | $38,700 | $0 | $0 |
| 2014 | $1,691 | $38,700 | $0 | $0 |
Source: Public Records
Map
Nearby Homes
- 8272 Stonebrier Ln
- 5031 Sawyer Lake Dr
- 8209 Blue Lagoon Dr
- 5151 Sawyer Hollow Dr
- 8215 White Wing Ln
- 4821 Oak Crest Cove
- 8132 White Wing Cove W
- 8051 Bourne Rd
- 7960 Abington Woods Ave
- 8658 Baylor Rd
- 8355 Craven Rd
- 4836 Shadow Pine Cove
- 4500 Greencedar Ln
- 4621 Westbrook Rd
- 8787 Kinder Mill Cove
- 7686 Shadow Glen Ln
- 7590 Romero Dr
- 4863 Valley von Way
- 4433 Society Rd
- 8947 Village Lake Ln
- 5005 Wolfchase Farms Pkwy
- 8221 Buckhead Ln
- 8217 Buckhead Ln
- 8232 Old Brownsville Rd
- 4986 Wolfchase Farms Pkwy
- 8228 Old Brownsville Rd
- 5004 Wolfchase Farms Pkwy
- 8222 Old Brownsville Rd
- 8213 Buckhead Ln
- 8246 Old Brownsville Rd
- 5014 Wolfchase Farms Pkwy
- 5021 Wolfchase Farms Pkwy
- 8257 Stonebrier Ln
- 8222 Buckhead Ln
- 8256 Stonebrier Ln
- 8216 Old Brownsville Rd
- 8216 Buckhead Ln
- 5020 Wolfchase Farms Pkwy Unit ES
- 8254 Old Brownsville Rd
- 8209 Buckhead Ln