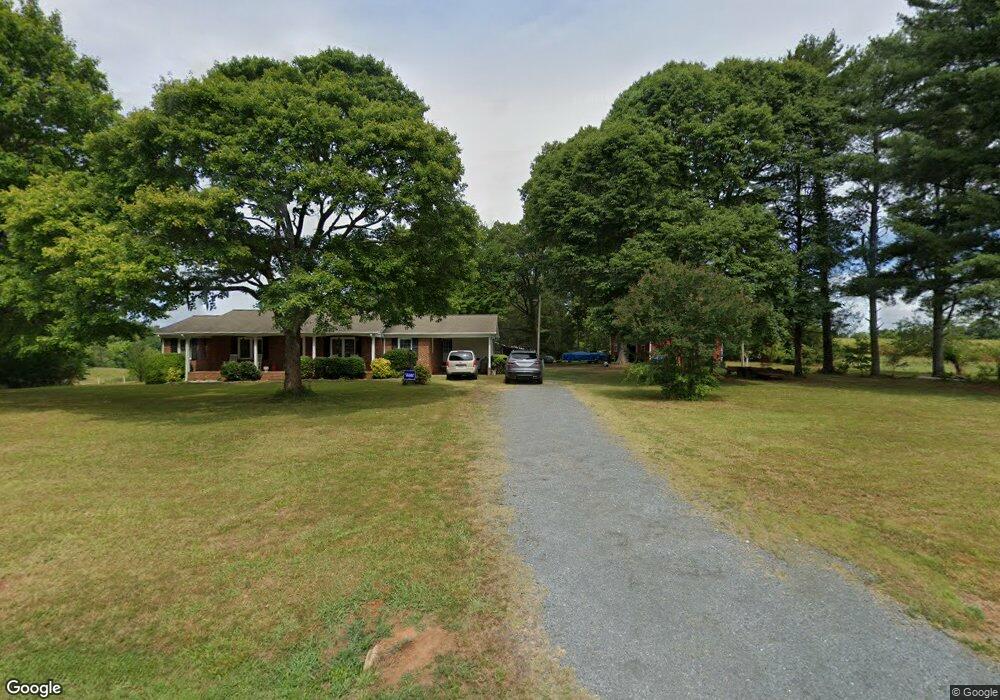
4996 Little Beane Store Rd Seagrove, NC 27341
Estimated Value: $254,000 - $383,000
--
Bed
2
Baths
1,657
Sq Ft
$203/Sq Ft
Est. Value
About This Home
This home is located at 4996 Little Beane Store Rd, Seagrove, NC 27341 and is currently estimated at $336,004, approximately $202 per square foot. 4996 Little Beane Store Rd is a home located in Randolph County with nearby schools including Coleridge Elementary School, Southeastern Randolph Middle School, and Eastern Randolph High School.
Ownership History
Date
Name
Owned For
Owner Type
Purchase Details
Closed on
Apr 28, 2021
Sold by
Lautenschleger Roy and Lautenschleger Donna K
Bought by
Lautenschleger Roy and Lautenschleger Donna
Current Estimated Value
Purchase Details
Closed on
Apr 1, 2010
Sold by
Potts Moffitt Russell Jackson and Potts Moffitt Susan
Bought by
Lautenschleger Donna Kay L
Purchase Details
Closed on
Mar 23, 2007
Sold by
Walker John K and Walker Rana T
Bought by
Lautenschleger Roy and Lautenschleger Donna K
Purchase Details
Closed on
Sep 26, 1997
Bought by
Lautenschleger Roy Lautenschleger
Purchase Details
Closed on
Aug 18, 1994
Bought by
Lautenschleger Roy Lautenschleger
Purchase Details
Closed on
Apr 22, 1992
Bought by
Lautenschleger Roy Lautenschleger
Purchase Details
Closed on
Nov 27, 1989
Bought by
Lautenschleger Roy Lautenschleger
Create a Home Valuation Report for This Property
The Home Valuation Report is an in-depth analysis detailing your home's value as well as a comparison with similar homes in the area
Home Values in the Area
Average Home Value in this Area
Purchase History
| Date | Buyer | Sale Price | Title Company |
|---|---|---|---|
| Lautenschleger Roy | -- | None Available | |
| Lautenschleger Donna Kay L | $26,000 | None Available | |
| Lautenschleger Roy | $160,000 | None Available | |
| Lautenschleger Roy Lautenschleger | $135,000 | -- | |
| Lautenschleger Roy Lautenschleger | $105,000 | -- | |
| Lautenschleger Roy Lautenschleger | $93,500 | -- | |
| Lautenschleger Roy Lautenschleger | $87,500 | -- |
Source: Public Records
Tax History Compared to Growth
Tax History
| Year | Tax Paid | Tax Assessment Tax Assessment Total Assessment is a certain percentage of the fair market value that is determined by local assessors to be the total taxable value of land and additions on the property. | Land | Improvement |
|---|---|---|---|---|
| 2025 | $1,575 | $262,070 | $109,590 | $152,480 |
| 2024 | $1,575 | $262,070 | $109,590 | $152,480 |
| 2023 | $1,575 | $262,070 | $109,590 | $152,480 |
| 2022 | $1,405 | $191,240 | $83,120 | $108,120 |
| 2021 | $1,405 | $191,240 | $83,120 | $108,120 |
| 2020 | $1,355 | $191,240 | $83,120 | $108,120 |
| 2019 | $1,355 | $191,240 | $83,120 | $108,120 |
| 2018 | $1,271 | $174,540 | $72,880 | $101,660 |
| 2016 | $1,213 | $167,013 | $72,880 | $94,133 |
| 2015 | $1,218 | $167,013 | $72,880 | $94,133 |
| 2014 | -- | $167,013 | $72,880 | $94,133 |
Source: Public Records
Map
Nearby Homes
- 3480 Old Bachelor Creek Rd
- 0 Woodfern Rd
- 4242 Woodfern Rd
- 6781 Erect Rd
- 4317 Timber Lea Ln
- 4329 Timber Lea Ln
- 4379 Timber Lea Ln
- 4387 Timber Lea Ln
- 7906 Nc Highway 42 S
- 0 Old Nc Highway 13 Unit 1172458
- 4142 Sadie Rd
- 3158 Cane Mill Rd
- 4417 N Carolina 42
- 4417 Nc Highway 42 S
- 3963 N Carolina 42
- 3961 N Carolina 42
- 6020 River Heights Dr
- 6070 River Heights Dr
- 3736 Buffalo Ford Rd
- 2132 Sunbeam Ct
- 5009 Little Beane Store Rd
- 4987 Little Beane Store Rd
- 5126 Little Beane Store Rd
- 5131 Little Beane Store Rd
- 4820 Little Beane Store Rd
- 5193 Little Beane Store Rd
- 3488 Old Bachelor Creek Rd
- 5219 Little Beane Store Rd
- 5195 Little Beane Store Rd
- 4791 Little Beane Store Rd
- 4784 Little Beane Store Rd
- 3555 Old Bachelor Creek Rd
- 5251 Little Beane Store Rd
- 0 Old Bachelor Creek Rd
- 3470 Old Bachelor Creek Rd
- 3448 Old Bachelor Creek Rd
- 5250 Little Beane Store Rd
- 5285 Little Beane Store Rd
- 4764 Little Beane Store Rd
- 5322 Little Beane Store Rd