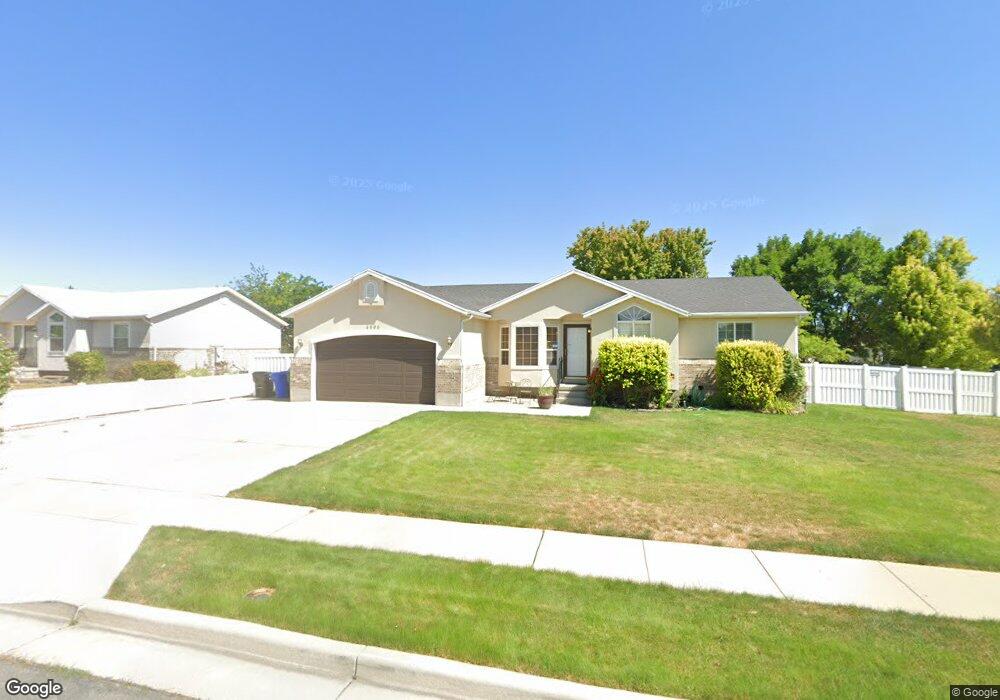
4996 W 7670 S West Jordan, UT 84081
Shadow Mountain NeighborhoodEstimated Value: $570,000 - $635,000
5
Beds
3
Baths
2,550
Sq Ft
$236/Sq Ft
Est. Value
About This Home
This home is located at 4996 W 7670 S, West Jordan, UT 84081 and is currently estimated at $602,263, approximately $236 per square foot. 4996 W 7670 S is a home located in Salt Lake County with nearby schools including Hayden Peak Elementary School, West Hills Middle School, and Copper Hills High School.
Ownership History
Date
Name
Owned For
Owner Type
Purchase Details
Closed on
Jun 16, 2021
Sold by
Siragusa April C and Siragusa Ross D
Bought by
Siragusa April Cleveland and Siragusa Ross David
Current Estimated Value
Home Financials for this Owner
Home Financials are based on the most recent Mortgage that was taken out on this home.
Original Mortgage
$304,500
Outstanding Balance
$231,195
Interest Rate
2.9%
Mortgage Type
New Conventional
Estimated Equity
$371,068
Purchase Details
Closed on
Apr 26, 2021
Sold by
Siragusa Ross D and Siragusa April C
Bought by
Siragusa April Cleveland and Siragusa Ross David
Home Financials for this Owner
Home Financials are based on the most recent Mortgage that was taken out on this home.
Original Mortgage
$304,500
Outstanding Balance
$231,195
Interest Rate
2.9%
Mortgage Type
New Conventional
Estimated Equity
$371,068
Purchase Details
Closed on
Apr 18, 2017
Sold by
Watson James Eric and Watson Laura K
Bought by
Siragusa Ross D and Siragusa April C
Home Financials for this Owner
Home Financials are based on the most recent Mortgage that was taken out on this home.
Original Mortgage
$318,250
Interest Rate
4.21%
Mortgage Type
New Conventional
Purchase Details
Closed on
Apr 22, 2010
Sold by
Woolstenhulme Wendy
Bought by
Watson James Eric and Watson Laura K
Home Financials for this Owner
Home Financials are based on the most recent Mortgage that was taken out on this home.
Original Mortgage
$220,924
Interest Rate
5.5%
Mortgage Type
FHA
Purchase Details
Closed on
Dec 28, 2006
Sold by
Barlocker Kimberly A and Woolstenhulme Wendy
Bought by
Barlocker Kimberly and Woolstenhulme Wendy
Home Financials for this Owner
Home Financials are based on the most recent Mortgage that was taken out on this home.
Original Mortgage
$54,000
Interest Rate
6.16%
Mortgage Type
New Conventional
Purchase Details
Closed on
Oct 20, 1999
Sold by
Design Builders Lc
Bought by
Barlocker Kimberly A and Woolstenhulme Wendy
Home Financials for this Owner
Home Financials are based on the most recent Mortgage that was taken out on this home.
Original Mortgage
$152,750
Interest Rate
7.86%
Purchase Details
Closed on
Jun 28, 1999
Sold by
Kfp Corp
Bought by
Design Builders Lc
Home Financials for this Owner
Home Financials are based on the most recent Mortgage that was taken out on this home.
Original Mortgage
$128,700
Interest Rate
7.24%
Mortgage Type
Construction
Create a Home Valuation Report for This Property
The Home Valuation Report is an in-depth analysis detailing your home's value as well as a comparison with similar homes in the area
Home Values in the Area
Average Home Value in this Area
Purchase History
| Date | Buyer | Sale Price | Title Company |
|---|---|---|---|
| Siragusa April Cleveland | -- | Vanguard Title Union Park | |
| Siragusa April C | -- | Vanguard Title Union Park | |
| Siragusa April Cleveland | -- | None Available | |
| Siragusa Ross D | -- | Silver Laef Title Ins Agcy | |
| Watson James Eric | -- | Bonneville Superior Title | |
| Barlocker Kimberly | -- | Backman Title Services | |
| Barlocker Kimberly A | -- | Merrill Title | |
| Design Builders Lc | -- | Meridian Title |
Source: Public Records
Mortgage History
| Date | Status | Borrower | Loan Amount |
|---|---|---|---|
| Open | Siragusa April C | $304,500 | |
| Closed | Siragusa Ross D | $318,250 | |
| Previous Owner | Watson James Eric | $220,924 | |
| Previous Owner | Barlocker Kimberly | $54,000 | |
| Previous Owner | Barlocker Kimberly A | $152,750 | |
| Previous Owner | Design Builders Lc | $128,700 |
Source: Public Records
Tax History Compared to Growth
Tax History
| Year | Tax Paid | Tax Assessment Tax Assessment Total Assessment is a certain percentage of the fair market value that is determined by local assessors to be the total taxable value of land and additions on the property. | Land | Improvement |
|---|---|---|---|---|
| 2025 | $2,840 | $552,400 | $165,300 | $387,100 |
| 2024 | $2,840 | $546,400 | $158,900 | $387,500 |
| 2023 | $2,725 | $494,200 | $152,800 | $341,400 |
| 2022 | $2,817 | $502,600 | $149,800 | $352,800 |
| 2021 | $2,492 | $404,700 | $115,200 | $289,500 |
| 2020 | $2,350 | $358,200 | $106,000 | $252,200 |
| 2019 | $2,310 | $345,200 | $100,000 | $245,200 |
| 2018 | $2,120 | $314,300 | $100,000 | $214,300 |
| 2017 | $1,966 | $290,100 | $100,000 | $190,100 |
| 2016 | $1,766 | $244,800 | $105,000 | $139,800 |
| 2015 | $1,834 | $248,000 | $112,500 | $135,500 |
| 2014 | $1,792 | $238,500 | $108,900 | $129,600 |
Source: Public Records
Map
Nearby Homes
- 7908 Cold Stone Ln Unit N3
- 7882 S Dove Creek Ln Unit A6
- 7563 S Opal Mountain Way W Unit 306
- 7567 S Opal Mountain Way W Unit 307
- 7556 S Opal Mountain Way W Unit 311
- 7569 S Opal Mountain Way W Unit 308
- 7554 S Opal Mountain Way W Unit 310
- 7553 S Opal Mountain Way W Unit 302
- 7414 Regal Hill Dr
- 7502 S Lace Wood Dr Unit 417
- 5189 W Dove Creek Ln
- 7493 S Lace Wood Dr
- 5183 W Swift Water Way
- 5228 W Ranches Loop Rd
- 6880 S Survey Peak Ln
- 6884 S Survey Peak Ln
- 6888 S Survey Peak Ln
- 7288 Comet Hill Cir
- 4678 Emmons Dr
- 5298 W Icehouse Way
- 5016 W 7660 S
- 4995 Wood Spring Dr
- 7657 S 4980 W
- 5007 W Wood Spring Dr
- 5007 Wood Spring Dr
- 7686 Woodhue Ct
- 5032 W 7660 S
- 7643 S 4980 W
- 7685 Woodhue Ct
- 7685 S Woodhue Ct
- 7689 S 5040 W
- 4951 Wood Spring Dr
- 4962 W 7670 S
- 5023 Wood Spring Dr
- 5023 W Wood Spring Dr
- 4992 Wood Spring Dr
- 4992 W Wood Spring Dr
- 4992 W Wood Spring Dr
- 7698 Woodhue Ct
- 4963 Wood Spring Dr