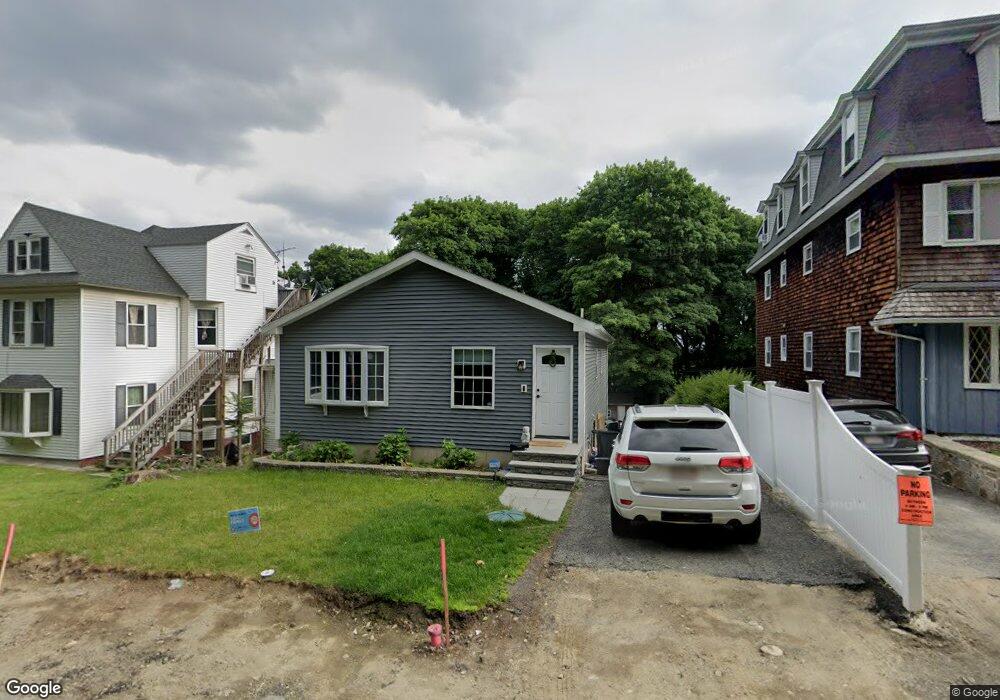
4A Hermitage Ln Worcester, MA 01605
Bell Hill NeighborhoodEstimated Value: $380,000 - $438,000
3
Beds
2
Baths
1,144
Sq Ft
$357/Sq Ft
Est. Value
About This Home
This home is located at 4A Hermitage Ln, Worcester, MA 01605 and is currently estimated at $408,794, approximately $357 per square foot. 4A Hermitage Ln is a home located in Worcester County with nearby schools including Jacob Hiatt Magnet School, Chandler Magnet, and Worcester East Middle School.
Ownership History
Date
Name
Owned For
Owner Type
Purchase Details
Closed on
Sep 9, 2024
Sold by
Minerva Landol Ret and Landol
Bought by
Rivas Erica L
Current Estimated Value
Purchase Details
Closed on
Apr 28, 2015
Sold by
Landol Minerva
Bought by
Minerva Landol Ret and Landol
Purchase Details
Closed on
Sep 16, 2008
Sold by
Homesales Inc
Bought by
Landol Minerva
Purchase Details
Closed on
Mar 19, 2008
Sold by
Phillips Robert and Jp Morgan Chase Bk
Bought by
Homesales Inc
Purchase Details
Closed on
Jan 23, 2006
Sold by
Abbascia Carl and Vitols Michael
Bought by
Phillips Robert L
Home Financials for this Owner
Home Financials are based on the most recent Mortgage that was taken out on this home.
Original Mortgage
$204,000
Interest Rate
6.33%
Mortgage Type
Purchase Money Mortgage
Purchase Details
Closed on
Aug 19, 2005
Sold by
Marhefka Linda W and Marhefka Robert E
Bought by
Abbascia Carl and Vitols Michael
Create a Home Valuation Report for This Property
The Home Valuation Report is an in-depth analysis detailing your home's value as well as a comparison with similar homes in the area
Home Values in the Area
Average Home Value in this Area
Purchase History
| Date | Buyer | Sale Price | Title Company |
|---|---|---|---|
| Rivas Erica L | -- | None Available | |
| Rivas Erica L | -- | None Available | |
| Minerva Landol Ret | -- | -- | |
| Landol Minerva | $162,500 | -- | |
| Homesales Inc | $178,500 | -- | |
| Phillips Robert L | $255,000 | -- | |
| Abbascia Carl | $57,500 | -- | |
| Minerva Landol Ret | -- | -- | |
| Landol Minerva | $162,500 | -- | |
| Homesales Inc | $178,500 | -- | |
| Phillips Robert L | $255,000 | -- | |
| Abbascia Carl | $57,500 | -- |
Source: Public Records
Mortgage History
| Date | Status | Borrower | Loan Amount |
|---|---|---|---|
| Previous Owner | Phillips Robert L | $204,000 |
Source: Public Records
Tax History
| Year | Tax Paid | Tax Assessment Tax Assessment Total Assessment is a certain percentage of the fair market value that is determined by local assessors to be the total taxable value of land and additions on the property. | Land | Improvement |
|---|---|---|---|---|
| 2025 | $5,403 | $409,600 | $96,400 | $313,200 |
| 2024 | $5,248 | $381,700 | $96,400 | $285,300 |
| 2023 | $5,158 | $359,700 | $83,800 | $275,900 |
| 2022 | $4,339 | $285,300 | $67,000 | $218,300 |
| 2021 | $4,254 | $261,300 | $53,600 | $207,700 |
| 2020 | $4,083 | $240,200 | $53,200 | $187,000 |
| 2019 | $3,807 | $211,500 | $46,500 | $165,000 |
| 2018 | $3,665 | $193,800 | $46,500 | $147,300 |
| 2017 | $3,711 | $193,100 | $46,500 | $146,600 |
| 2016 | $3,683 | $178,700 | $33,000 | $145,700 |
| 2015 | -- | $178,700 | $33,000 | $145,700 |
| 2014 | $3,492 | $178,700 | $33,000 | $145,700 |
Source: Public Records
Map
Nearby Homes
- 6 Mount Vernon St Unit D
- 26 Orne St
- 41 Westminster St
- 95 Green Hill Pkwy
- 78 Green Hill Pkwy
- 139 Lincoln St
- Lot 2 Ararat
- 15 Breck St
- 176 Lincoln St Unit 4
- 91 Stanton St
- 145 Eastern Ave
- 26 Vinson St
- 21 Kendall St
- 249 Lincoln St
- 33 Denmark St
- 51 Uxbridge St
- 27 Harlow St
- 15 Edward St
- 256 Belmont St
- 25 Johnson St
- 4 Hermitage Ln
- 6 Hermitage Ln
- 48 Channing St
- 8 Hermitage Ln
- 46 Channing St
- 46 Channing St Unit 1
- 44 Channing St
- 10 Hermitage Ln
- 42 Channing St
- 47 Channing St
- 49 Channing St
- 45 Channing St
- 15 Mount Vernon St
- 12 Hermitage Ln
- 40 Perkins St
- 40 Channing St
- 21 Mount Vernon St Unit 3D
- 21 Mount Vernon St Unit 3C
- 21 Mount Vernon St Unit 3B
- 21 Mount Vernon St Unit 3A
Your Personal Tour Guide
Ask me questions while you tour the home.