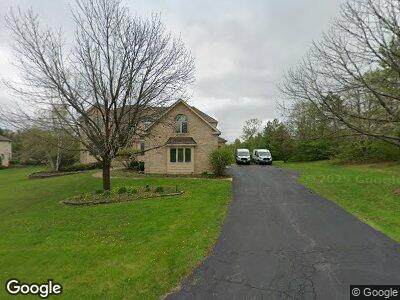
4N365 Saint Andrews Trace Ln West Chicago, IL 60185
Chicago West NeighborhoodEstimated Value: $648,599 - $836,000
4
Beds
5
Baths
4,050
Sq Ft
$189/Sq Ft
Est. Value
About This Home
This home is located at 4N365 Saint Andrews Trace Ln, West Chicago, IL 60185 and is currently estimated at $765,900, approximately $189 per square foot. 4N365 Saint Andrews Trace Ln is a home located in DuPage County with nearby schools including Hawk Hollow Elementary School, Eastview Middle School, and Bartlett High School.
Ownership History
Date
Name
Owned For
Owner Type
Purchase Details
Closed on
Feb 17, 1997
Sold by
Campanella Michael and Campanella Nicoletta
Bought by
Pardon Robert E and Andre Pardon Sandra L
Current Estimated Value
Create a Home Valuation Report for This Property
The Home Valuation Report is an in-depth analysis detailing your home's value as well as a comparison with similar homes in the area
Home Values in the Area
Average Home Value in this Area
Purchase History
| Date | Buyer | Sale Price | Title Company |
|---|---|---|---|
| Pardon Robert E | $80,000 | -- |
Source: Public Records
Mortgage History
| Date | Status | Borrower | Loan Amount |
|---|---|---|---|
| Open | Pardon Robert E | $274,608 | |
| Closed | Pardon Robert E | $329,500 | |
| Closed | Pardon Robert E | $347,000 | |
| Closed | Pardon Robert E | $392,000 | |
| Closed | Pardon Robert E | $50,000 | |
| Closed | Pardon Robert E | $395,000 |
Source: Public Records
Tax History Compared to Growth
Tax History
| Year | Tax Paid | Tax Assessment Tax Assessment Total Assessment is a certain percentage of the fair market value that is determined by local assessors to be the total taxable value of land and additions on the property. | Land | Improvement |
|---|---|---|---|---|
| 2023 | $13,424 | $217,030 | $49,300 | $167,730 |
| 2022 | $13,488 | $201,700 | $45,820 | $155,880 |
| 2021 | $13,072 | $191,480 | $43,500 | $147,980 |
| 2020 | $12,784 | $185,740 | $42,200 | $143,540 |
| 2019 | $12,618 | $179,110 | $40,690 | $138,420 |
| 2018 | $13,423 | $184,300 | $41,870 | $142,430 |
| 2017 | $13,000 | $176,950 | $40,200 | $136,750 |
| 2016 | $13,946 | $183,720 | $41,740 | $141,980 |
| 2015 | $14,138 | $173,910 | $39,510 | $134,400 |
| 2014 | $12,952 | $169,030 | $41,860 | $127,170 |
| 2013 | $16,398 | $173,080 | $42,860 | $130,220 |
Source: Public Records
Map
Nearby Homes
- Ashburn Ashburn Ln
- 4N671 Petersdorf Rd
- 30W010 Smith Rd
- 30W201 Dean Ct
- 29W725 Army Trail Rd
- 30W170 Whitney Rd
- 4N707 White Oak Ln
- 29W221 Oak Knoll Rd
- 4N210 Norris Ave
- 3N685 Kenwood Ave
- 3N531 Locust Ave
- 1751 Rizzi Ln
- 4N045 Wiant Rd
- 29W250 Old Wayne Ct
- 3N251 Lakewood Dr
- 1442 Preserve Dr Unit 26
- 1007 Quarry Ct Unit 2
- 1446 Preserve Dr Unit 25
- 1697 Gerber Rd
- 1395 Potomac Ct
- 4N365 Saint Andrews Trace Ln
- 4N385 Saint Andrews Trace Ln
- 4N355 Saint Andrews Trace Ln
- 4N368 Saint Andrews Trace Ln
- 4N340 Saint Andrews Trace Ln
- 4N340 Saint Andrews Trace Ln
- 4N365 Waterford Ln
- 4N435 Saint Andrews Trace Ln
- 4N450 Saint Andrews Trace Ln
- 4N364 Waterford Ln
- 4N455 Saint Andrews Trace Ln
- 4N340 Waterford Ln
- 4N471 Saint Andrews Trace Ln
- 4N470 Trinity Ln
- 4N471 St Andrews Trace
- 4N231 Saint Andrews Trace Ln
- 4N435 Saint James Way
- 4N400 Waterford Ln
- 4N450 Cambridge Dr
- 29W309 Canterbury Dr