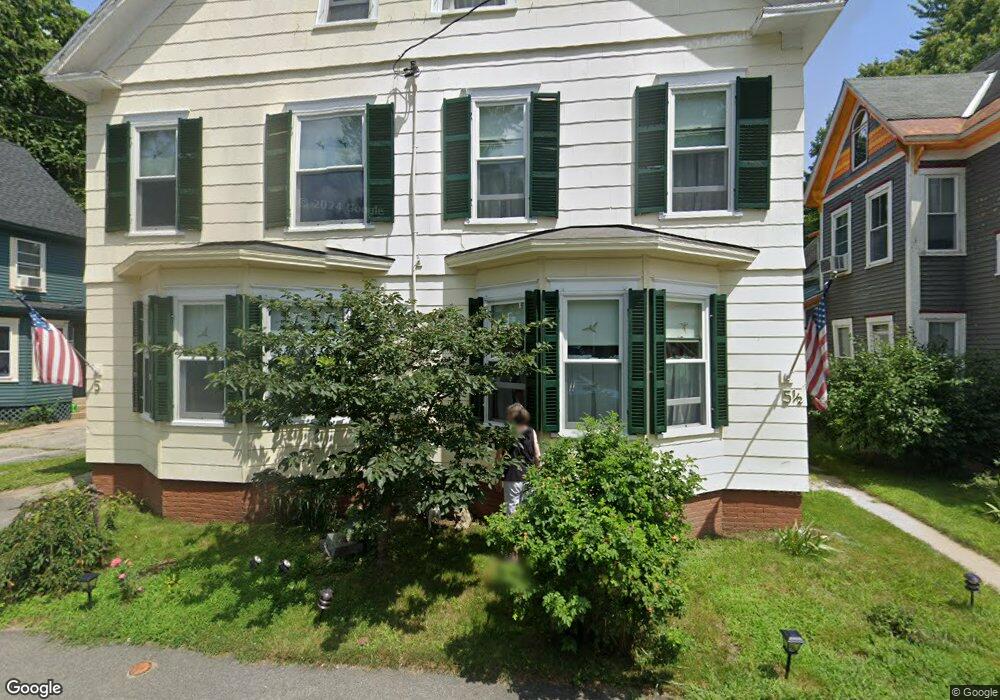
5 1/2 Morton St Concord, NH 03301
South End NeighborhoodEstimated Value: $396,000 - $495,000
5
Beds
2
Baths
2,895
Sq Ft
$151/Sq Ft
Est. Value
About This Home
This home is located at 5 1/2 Morton St, Concord, NH 03301 and is currently estimated at $438,541, approximately $151 per square foot. 5 1/2 Morton St is a home located in Merrimack County with nearby schools including Abbot-Downing School, Rundlett Middle School, and Concord High School.
Ownership History
Date
Name
Owned For
Owner Type
Purchase Details
Closed on
Nov 16, 2004
Sold by
Hemphill H M
Bought by
Unknown
Current Estimated Value
Home Financials for this Owner
Home Financials are based on the most recent Mortgage that was taken out on this home.
Original Mortgage
$80,000
Interest Rate
5.75%
Mortgage Type
Purchase Money Mortgage
Create a Home Valuation Report for This Property
The Home Valuation Report is an in-depth analysis detailing your home's value as well as a comparison with similar homes in the area
Home Values in the Area
Average Home Value in this Area
Purchase History
| Date | Buyer | Sale Price | Title Company |
|---|---|---|---|
| Unknown | $160,000 | -- |
Source: Public Records
Mortgage History
| Date | Status | Borrower | Loan Amount |
|---|---|---|---|
| Open | Unknown | $130,500 | |
| Closed | Unknown | $80,000 |
Source: Public Records
Tax History Compared to Growth
Tax History
| Year | Tax Paid | Tax Assessment Tax Assessment Total Assessment is a certain percentage of the fair market value that is determined by local assessors to be the total taxable value of land and additions on the property. | Land | Improvement |
|---|---|---|---|---|
| 2024 | $6,045 | $218,300 | $91,800 | $126,500 |
| 2023 | $5,864 | $218,300 | $91,800 | $126,500 |
| 2022 | $5,652 | $218,300 | $91,800 | $126,500 |
| 2021 | $6,026 | $239,900 | $91,800 | $148,100 |
| 2020 | $5,507 | $205,800 | $76,800 | $129,000 |
| 2019 | $5,253 | $189,100 | $73,400 | $115,700 |
| 2018 | $5,336 | $189,300 | $73,400 | $115,900 |
| 2017 | $5,309 | $188,000 | $72,100 | $115,900 |
| 2016 | $4,765 | $172,200 | $72,100 | $100,100 |
| 2015 | $4,333 | $158,500 | $65,600 | $92,900 |
| 2014 | $4,249 | $158,500 | $65,600 | $92,900 |
| 2013 | $3,834 | $149,900 | $65,600 | $84,300 |
| 2012 | $4,033 | $165,500 | $65,600 | $99,900 |
Source: Public Records
Map
Nearby Homes
- 24 Badger St
- 0 Spruce St Unit 88
- 33 Spruce St
- 14 Downing St
- 14-16 Perley St
- 75 S State St
- 10 Perley St
- 87 S Main St Unit 2
- 47 South St
- 105 S Main St
- 12 Avon St
- 122 South St
- 4 Fayette St
- 54 Pleasant St Unit 8
- 0 South St Unit 4969509
- 15 Wilson Ave
- 22 Wilson Ave
- 376 S Main St
- 17 Essex St
- 22 Longmeadow Dr
- 7 Morton St
- 3 Morton St
- 9 Morton St Unit 11
- 100 S State St
- 9-11 Morton St
- 4 1/2 Morton St
- 6 Morton St
- 11 Morton St
- 29-31 West St
- 102 S State St Unit 104
- 98 S State St
- 8 Morton St
- 33 West St
- 27 1/2 West St
- 27-27.5 West St
- 29 West St Unit 31
- 13 Morton St
- 13 Morton St Unit Second Floor
- 96 S State St
- 10 Morton St