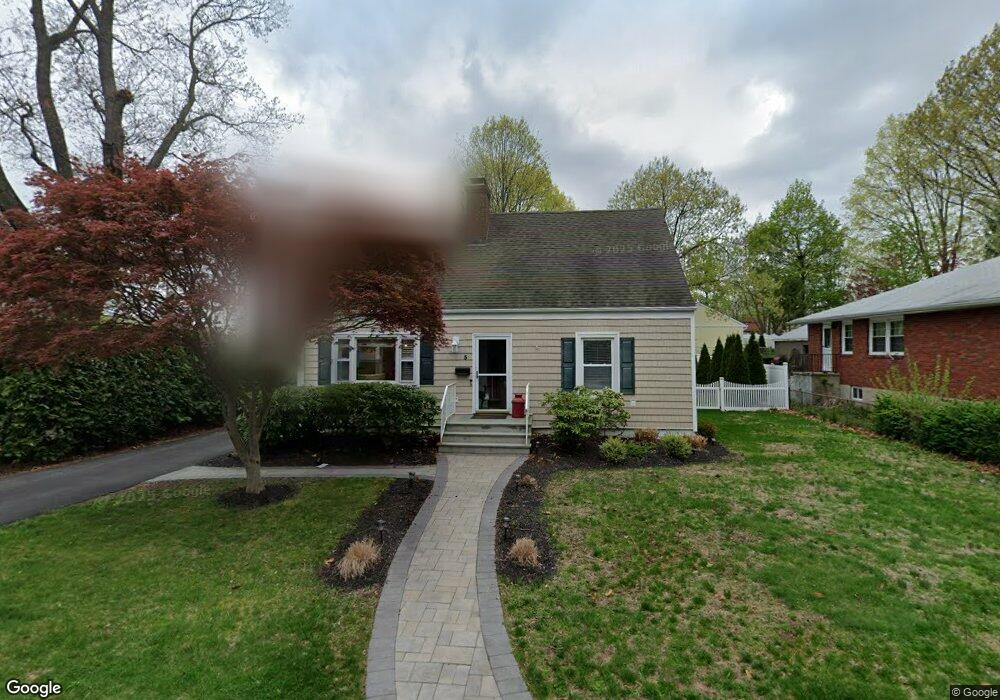
5 2nd Ave Ossining, NY 10562
Estimated Value: $607,000 - $686,000
5
Beds
2
Baths
1,547
Sq Ft
$421/Sq Ft
Est. Value
About This Home
This home is located at 5 2nd Ave, Ossining, NY 10562 and is currently estimated at $650,669, approximately $420 per square foot. 5 2nd Ave is a home located in Westchester County with nearby schools including Park School, Roosevelt Elementary School, and Brookside Elementary School.
Ownership History
Date
Name
Owned For
Owner Type
Purchase Details
Closed on
May 2, 2022
Sold by
Nolan and Leah
Bought by
Randolph John and Grenade Stephanie
Current Estimated Value
Home Financials for this Owner
Home Financials are based on the most recent Mortgage that was taken out on this home.
Original Mortgage
$506,653
Outstanding Balance
$480,657
Interest Rate
5.1%
Mortgage Type
FHA
Estimated Equity
$170,012
Purchase Details
Closed on
Feb 5, 2018
Sold by
Fracassi Patricia A
Bought by
Fracassi Lewis P and Fracassi Moore Lori
Create a Home Valuation Report for This Property
The Home Valuation Report is an in-depth analysis detailing your home's value as well as a comparison with similar homes in the area
Home Values in the Area
Average Home Value in this Area
Purchase History
| Date | Buyer | Sale Price | Title Company |
|---|---|---|---|
| Randolph John | $516,000 | None Listed On Document | |
| Fracassi Lewis P | -- | Throughbred Title Services L |
Source: Public Records
Mortgage History
| Date | Status | Borrower | Loan Amount |
|---|---|---|---|
| Open | Randolph John | $506,653 |
Source: Public Records
Tax History
| Year | Tax Paid | Tax Assessment Tax Assessment Total Assessment is a certain percentage of the fair market value that is determined by local assessors to be the total taxable value of land and additions on the property. | Land | Improvement |
|---|---|---|---|---|
| 2024 | $15,400 | $477,800 | $154,400 | $323,400 |
| 2023 | $14,069 | $450,200 | $154,400 | $295,800 |
| 2022 | $13,814 | $384,400 | $154,400 | $230,000 |
| 2021 | $12,144 | $343,200 | $154,400 | $188,800 |
| 2020 | $13,321 | $343,200 | $154,400 | $188,800 |
| 2019 | $7,347 | $306,800 | $154,400 | $152,400 |
| 2018 | $6,550 | $306,800 | $154,400 | $152,400 |
| 2017 | $1,240 | $300,900 | $154,400 | $146,500 |
| 2016 | $39,732 | $295,000 | $154,400 | $140,600 |
| 2015 | $6,201 | $15,800 | $4,700 | $11,100 |
| 2014 | $6,201 | $15,800 | $4,700 | $11,100 |
| 2013 | $6,201 | $15,800 | $4,700 | $11,100 |
Source: Public Records
Map
Nearby Homes
Your Personal Tour Guide
Ask me questions while you tour the home.