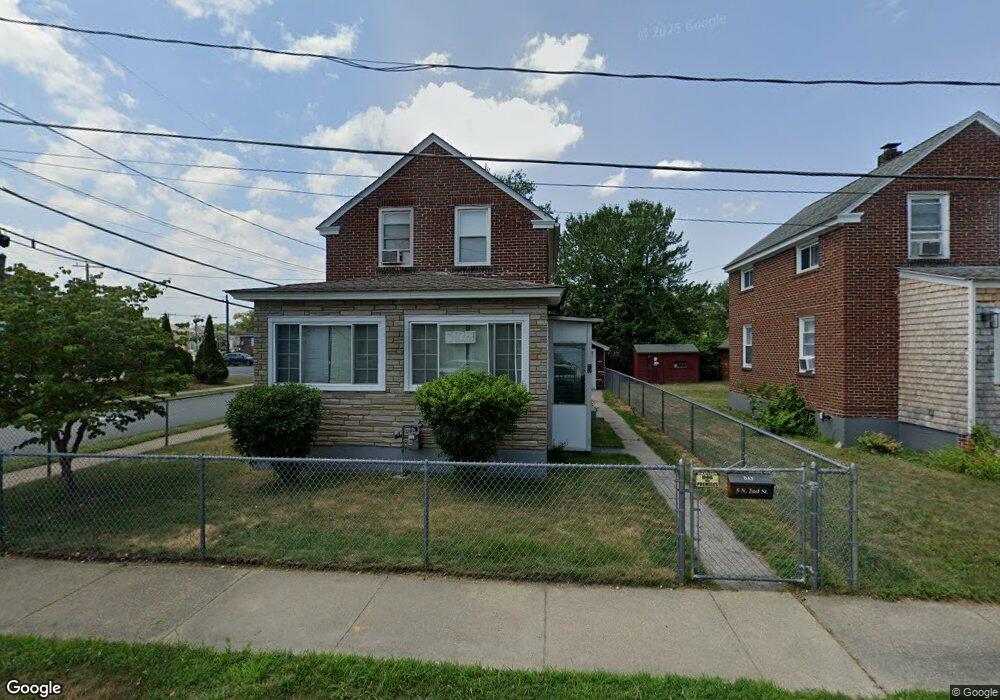
5 2nd St Nashua, NH 03060
Mine Falls Park NeighborhoodEstimated Value: $391,000 - $443,758
10
Beds
4
Baths
1,534
Sq Ft
$273/Sq Ft
Est. Value
About This Home
This home is located at 5 2nd St, Nashua, NH 03060 and is currently estimated at $418,190, approximately $272 per square foot. 5 2nd St is a home located in Hillsborough County with nearby schools including Ledge Street Elementary School, Fairgrounds Middle School, and Nashua High School South.
Ownership History
Date
Name
Owned For
Owner Type
Purchase Details
Closed on
Apr 1, 2005
Sold by
Dupont Justin C and Dupont Rita M
Bought by
Campbell Edward
Current Estimated Value
Home Financials for this Owner
Home Financials are based on the most recent Mortgage that was taken out on this home.
Original Mortgage
$220,000
Outstanding Balance
$108,541
Interest Rate
5.61%
Mortgage Type
Purchase Money Mortgage
Estimated Equity
$309,649
Create a Home Valuation Report for This Property
The Home Valuation Report is an in-depth analysis detailing your home's value as well as a comparison with similar homes in the area
Home Values in the Area
Average Home Value in this Area
Purchase History
| Date | Buyer | Sale Price | Title Company |
|---|---|---|---|
| Campbell Edward | $275,000 | -- |
Source: Public Records
Mortgage History
| Date | Status | Borrower | Loan Amount |
|---|---|---|---|
| Open | Campbell Edward | $124,000 | |
| Open | Campbell Edward | $220,000 |
Source: Public Records
Tax History
| Year | Tax Paid | Tax Assessment Tax Assessment Total Assessment is a certain percentage of the fair market value that is determined by local assessors to be the total taxable value of land and additions on the property. | Land | Improvement |
|---|---|---|---|---|
| 2025 | $5,594 | $332,400 | $116,500 | $215,900 |
| 2024 | $5,285 | $332,400 | $116,500 | $215,900 |
| 2023 | $5,155 | $282,800 | $93,200 | $189,600 |
| 2022 | $5,110 | $282,800 | $93,200 | $189,600 |
| 2021 | $4,307 | $185,500 | $59,000 | $126,500 |
| 2020 | $4,194 | $185,500 | $59,000 | $126,500 |
| 2019 | $4,036 | $185,500 | $59,000 | $126,500 |
| 2018 | $3,934 | $185,500 | $59,000 | $126,500 |
| 2017 | $4,006 | $138,400 | $56,200 | $82,200 |
| 2016 | $3,470 | $138,400 | $56,200 | $82,200 |
| 2015 | $3,395 | $138,400 | $56,200 | $82,200 |
| 2014 | $3,329 | $138,400 | $56,200 | $82,200 |
Source: Public Records
Map
Nearby Homes
- 169A W Hollis St Unit 193
- 22 Wilder St
- 103 Ash St
- 14 Pleasant St
- 27 Wason Ave
- 63 Tampa St
- 72 Linwood St
- 32 Fairview Ave
- 11 Charles St
- 18-20 Maple St
- 57 Baldwin St
- 22 Kern Dr
- 25 Kern Dr Unit 25
- 15 Lovell St Unit 3
- 0 Baldwin St
- 14 Artillery Ln Unit A
- 5 Merrimack St
- 24 E Otterson St
- 9-11 Mason St
- 7 Morrill St
Your Personal Tour Guide
Ask me questions while you tour the home.