5 4th Ave Taunton, MA 02780
Whittenton NeighborhoodEstimated Value: $512,797 - $590,000
4
Beds
2
Baths
1,918
Sq Ft
$291/Sq Ft
Est. Value
About This Home
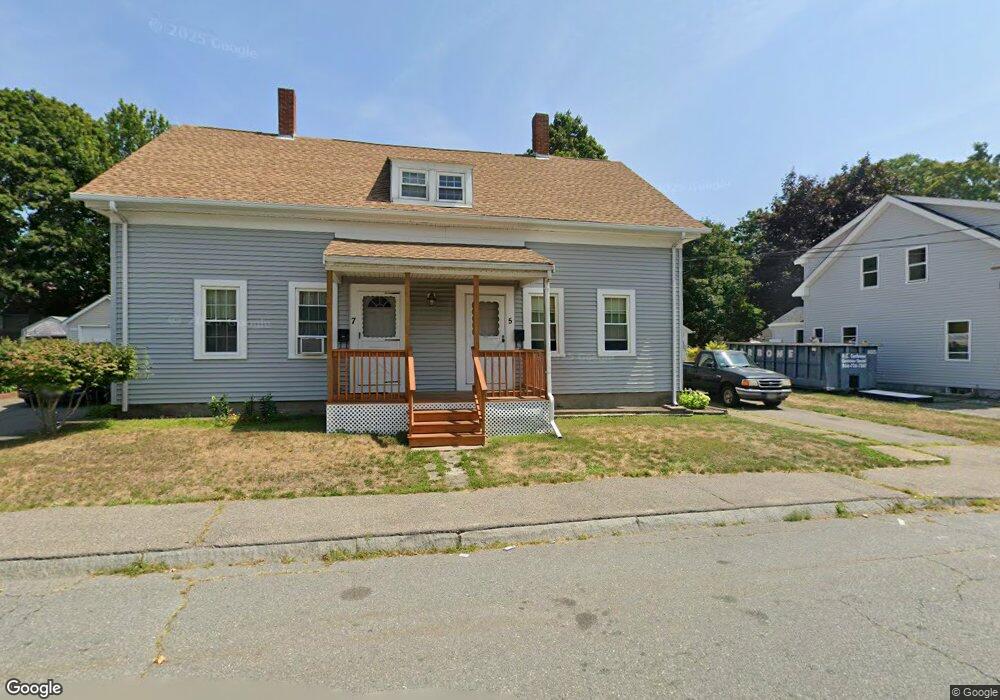
This home is located at 5 4th Ave, Taunton, MA 02780 and is currently estimated at $557,449, approximately $290 per square foot. 5 4th Ave is a home located in Bristol County with nearby schools including Hopewell, Benjamin Friedman Middle School, and Taunton High School.
Ownership History
Date
Name
Owned For
Owner Type
Purchase Details
Closed on
Nov 14, 1995
Sold by
Menard Normand F and Menard Dianne M
Bought by
Marra Joseph J and Marra Paulette
Current Estimated Value
Home Financials for this Owner
Home Financials are based on the most recent Mortgage that was taken out on this home.
Original Mortgage
$112,200
Interest Rate
7.62%
Mortgage Type
Purchase Money Mortgage
Create a Home Valuation Report for This Property
The Home Valuation Report is an in-depth analysis detailing your home's value as well as a comparison with similar homes in the area
Home Values in the Area
Average Home Value in this Area
Purchase History
| Date | Buyer | Sale Price | Title Company |
|---|---|---|---|
| Marra Joseph J | $110,000 | -- |
Source: Public Records
Mortgage History
| Date | Status | Borrower | Loan Amount |
|---|---|---|---|
| Open | Marra Joseph J | $125,000 | |
| Closed | Marra Joseph J | $112,200 |
Source: Public Records
Tax History
| Year | Tax Paid | Tax Assessment Tax Assessment Total Assessment is a certain percentage of the fair market value that is determined by local assessors to be the total taxable value of land and additions on the property. | Land | Improvement |
|---|---|---|---|---|
| 2025 | $5,169 | $472,500 | $105,300 | $367,200 |
| 2024 | $4,605 | $411,500 | $105,300 | $306,200 |
| 2023 | $4,222 | $350,400 | $105,300 | $245,100 |
| 2022 | $4,343 | $329,500 | $87,800 | $241,700 |
| 2021 | $3,891 | $274,000 | $79,800 | $194,200 |
| 2020 | $3,719 | $250,300 | $79,800 | $170,500 |
| 2019 | $3,437 | $218,100 | $79,800 | $138,300 |
| 2018 | $3,201 | $203,600 | $80,600 | $123,000 |
| 2017 | $2,974 | $189,300 | $76,400 | $112,900 |
| 2016 | $2,934 | $187,100 | $74,200 | $112,900 |
| 2015 | $2,694 | $179,500 | $73,300 | $106,200 |
| 2014 | $2,649 | $181,300 | $73,300 | $108,000 |
Source: Public Records
Map
Nearby Homes
- 3 4th Ave
- 28 Cottage St
- 0 Whittenton St
- 1 Elizabeth St
- 10 Johnny Mac Way Unit B
- 34 Warren St
- 56 Whittenton St
- 17 Green St
- 563 Whittenton St
- 5 Green St
- 399 Danforth St
- 63 Vaillancourt St
- 10 Jefferson Ave
- 19 Abbey Ln
- 191 Red Oak Terrace
- 9 Jefferson St
- 214 Eldridge St
- 0 Montclair Ave Unit 72130752
- 168 Broadway
- 110 Eldridge St Unit B