Estimated Value: $2,174,000 - $4,313,856
4
Beds
3
Baths
2,236
Sq Ft
$1,404/Sq Ft
Est. Value
About This Home
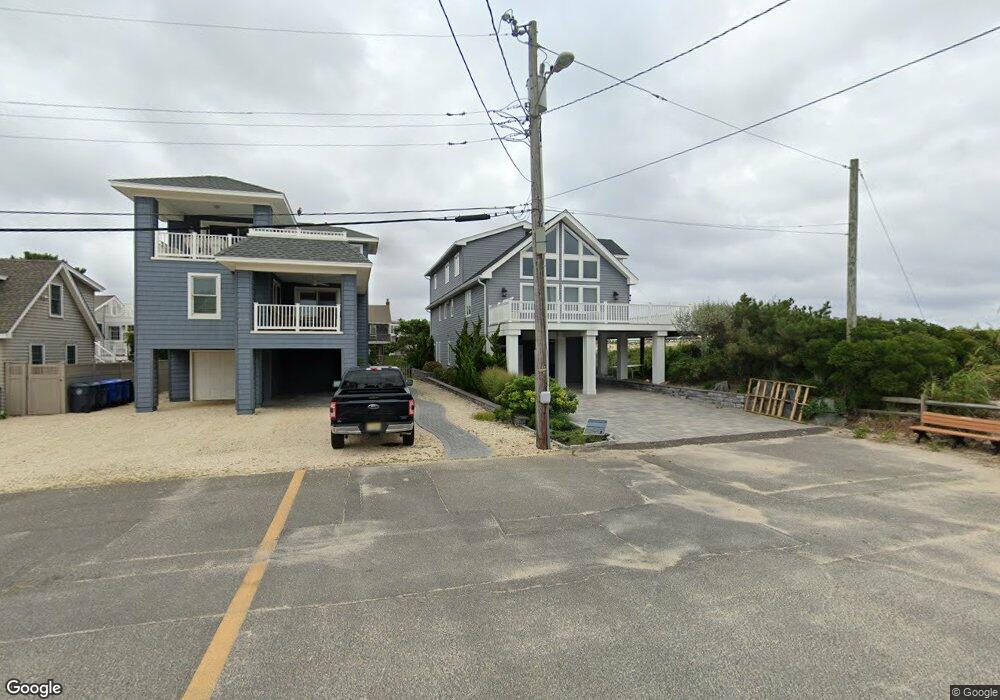
This home is located at 5 4th St, Beach Haven, NJ 08008 and is currently estimated at $3,139,952, approximately $1,404 per square foot. 5 4th St is a home located in Ocean County with nearby schools including Beach Haven School, Southern Regional Middle School, and Southern Regional High School.
Ownership History
Date
Name
Owned For
Owner Type
Purchase Details
Closed on
Dec 28, 2020
Sold by
Placitella Christopher M and Placitella Rachel A
Bought by
Rflbi Lp
Current Estimated Value
Purchase Details
Closed on
May 28, 1998
Sold by
Placitella Christopher M and Placitella Rachel A
Bought by
Placitella Rachel A
Purchase Details
Closed on
Feb 26, 1998
Sold by
Degnan John S
Bought by
Placitella Christopher M and Placitella Rachael A
Create a Home Valuation Report for This Property
The Home Valuation Report is an in-depth analysis detailing your home's value as well as a comparison with similar homes in the area
Home Values in the Area
Average Home Value in this Area
Purchase History
| Date | Buyer | Sale Price | Title Company |
|---|---|---|---|
| Rflbi Lp | -- | None Available | |
| Rflbi Lp | -- | None Listed On Document | |
| Placitella Rachel A | -- | -- | |
| Placitella Christopher M | $459,000 | -- |
Source: Public Records
Tax History
| Year | Tax Paid | Tax Assessment Tax Assessment Total Assessment is a certain percentage of the fair market value that is determined by local assessors to be the total taxable value of land and additions on the property. | Land | Improvement |
|---|---|---|---|---|
| 2025 | $35,727 | $2,723,100 | $2,494,000 | $229,100 |
| 2024 | $32,977 | $2,723,100 | $2,494,000 | $229,100 |
| 2023 | $30,635 | $2,723,100 | $2,494,000 | $229,100 |
| 2022 | $30,635 | $2,723,100 | $2,494,000 | $229,100 |
| 2021 | $29,872 | $2,723,100 | $2,494,000 | $229,100 |
| 2020 | $30,526 | $2,723,100 | $2,494,000 | $229,100 |
| 2019 | $29,655 | $2,723,100 | $2,494,000 | $229,100 |
| 2018 | $30,689 | $2,723,100 | $2,494,000 | $229,100 |
| 2017 | $29,301 | $2,723,100 | $2,494,000 | $229,100 |
| 2016 | $22,946 | $1,730,500 | $1,500,000 | $230,500 |
| 2015 | $21,960 | $1,730,500 | $1,500,000 | $230,500 |
| 2014 | $20,766 | $1,730,500 | $1,500,000 | $230,500 |
Source: Public Records
Map
Nearby Homes
- 23 5th St
- 106 5th St
- 301 N Beach Ave
- 708 N Atlantic Ave
- 225 4th St
- 218 7th St Unit A
- 225 E Fourth
- 222 7th St
- 5 9th St
- 601 N Del Ave Unit 12
- 320 3rd St
- 315 Centre St Unit 5
- 10 11th St
- 409 3rd St
- 221 11th St
- 1210 Long Beach Blvd Unit C2-01
- 1210 Long Beach Blvd Unit C1-01
- 11 E 13th St
- 26 Ocean St
- 1505 N Atlantic Ave
Your Personal Tour Guide
Ask me questions while you tour the home.