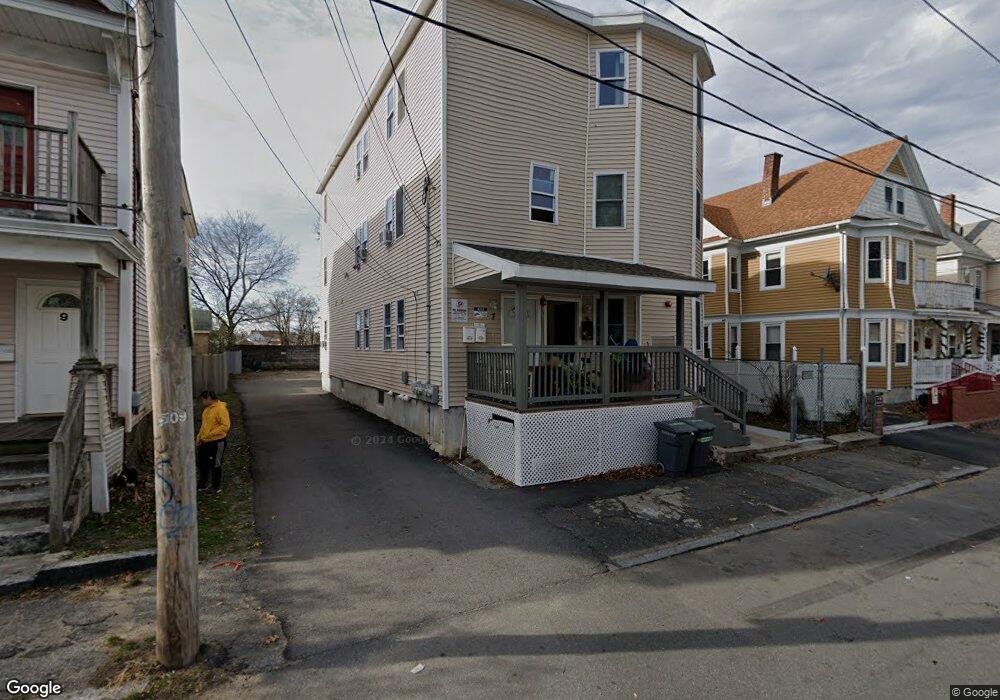
5-7 Garfield St Lawrence, MA 01843
South Common NeighborhoodEstimated Value: $851,930 - $950,000
9
Beds
3
Baths
3,960
Sq Ft
$230/Sq Ft
Est. Value
About This Home
This home is located at 5-7 Garfield St, Lawrence, MA 01843 and is currently estimated at $910,483, approximately $229 per square foot. 5-7 Garfield St is a home located in Essex County with nearby schools including Vardaman Elementary School, Olive Branch Elementary School, and Rowan Elementary School.
Ownership History
Date
Name
Owned For
Owner Type
Purchase Details
Closed on
Oct 30, 2020
Sold by
Anziani Jose
Bought by
Marte-Dejimenez Belkis Y and Jimenez-Beltre Elvy
Current Estimated Value
Home Financials for this Owner
Home Financials are based on the most recent Mortgage that was taken out on this home.
Original Mortgage
$598,951
Outstanding Balance
$531,764
Interest Rate
2.8%
Mortgage Type
FHA
Estimated Equity
$378,719
Purchase Details
Closed on
Jan 28, 2019
Sold by
Anziani Jose A and Anziani Anziano-Laurencio O
Bought by
Anziani Jose A
Home Financials for this Owner
Home Financials are based on the most recent Mortgage that was taken out on this home.
Original Mortgage
$439,242
Interest Rate
4.5%
Mortgage Type
FHA
Purchase Details
Closed on
Dec 16, 2016
Sold by
Bcad Llc
Bought by
Anziani Jose A and Anziani Oladis
Home Financials for this Owner
Home Financials are based on the most recent Mortgage that was taken out on this home.
Original Mortgage
$436,939
Interest Rate
3.5%
Mortgage Type
FHA
Purchase Details
Closed on
Jan 22, 2016
Sold by
Community Renovations
Bought by
Bcad Llc
Create a Home Valuation Report for This Property
The Home Valuation Report is an in-depth analysis detailing your home's value as well as a comparison with similar homes in the area
Home Values in the Area
Average Home Value in this Area
Purchase History
| Date | Buyer | Sale Price | Title Company |
|---|---|---|---|
| Marte-Dejimenez Belkis Y | $610,000 | None Available | |
| Marte-Dejimenez Belkis Y | $610,000 | None Available | |
| Anziani Jose A | -- | -- | |
| Anziani Jose A | -- | -- | |
| Anziani Jose A | $445,000 | -- | |
| Anziani Jose A | $445,000 | -- | |
| Bcad Llc | $30,000 | -- | |
| Bcad Llc | $30,000 | -- |
Source: Public Records
Mortgage History
| Date | Status | Borrower | Loan Amount |
|---|---|---|---|
| Open | Marte-Dejimenez Belkis Y | $598,951 | |
| Closed | Marte-Dejimenez Belkis Y | $598,951 | |
| Previous Owner | Anziani Jose A | $439,242 | |
| Previous Owner | Anziani Jose A | $436,939 |
Source: Public Records
Tax History Compared to Growth
Tax History
| Year | Tax Paid | Tax Assessment Tax Assessment Total Assessment is a certain percentage of the fair market value that is determined by local assessors to be the total taxable value of land and additions on the property. | Land | Improvement |
|---|---|---|---|---|
| 2025 | $6,771 | $769,400 | $114,700 | $654,700 |
| 2024 | $7,584 | $819,900 | $124,200 | $695,700 |
| 2023 | $7,081 | $696,900 | $115,100 | $581,800 |
| 2022 | $6,951 | $607,600 | $104,400 | $503,200 |
| 2021 | $6,567 | $535,200 | $104,400 | $430,800 |
| 2020 | $6,009 | $483,400 | $99,000 | $384,400 |
| 2019 | $6,428 | $469,900 | $82,300 | $387,600 |
| 2018 | $6,189 | $432,200 | $77,900 | $354,300 |
| 2017 | $4,424 | $288,400 | $73,600 | $214,800 |
| 2016 | $4,161 | $268,300 | $60,600 | $207,700 |
| 2015 | $4,082 | $270,000 | $60,600 | $209,400 |
Source: Public Records
Map
Nearby Homes
- 27-29 Dorchester St
- 356-360 S Union St
- 91 Farnham St
- 19 Front St
- 49 Bowdoin St Unit 51
- 132-134 S Broadway
- 24 Inman St Unit 32
- 5 Lafayette Ave
- 13 Kingston St
- 41 Durham St
- 82 S Broadway
- 67-69 Osgood St
- 78-80 Osgood St
- 91-93 Newton St
- 64 Salem St
- 5 W Kenneth St
- 629 Andover St
- 11 W Hawley St
- 77-79 Shawsheen Rd
- 34 Leeds Terrace
- 21 Garfield St
- 25 Garfield St
- 17 Garfield St
- 10 Cambridge St Unit 12
- 29 Garfield St
- 11 Cambridge St
- 9 Garfield St Unit 15
- 15-17 Cambridge St
- 57 Garfield St
- 15 Cambridge St Unit 17
- 8 Garfield St
- 13 Garfield St
- 6 Dorchester St
- 21 Cambridge St
- 31 Garfield St Unit 1
- 31 Garfield St
- 31 Garfield St Unit L
- 22 Cambridge St Unit 24
- 188 Boxford St Unit 190
- 12 Dorchester St