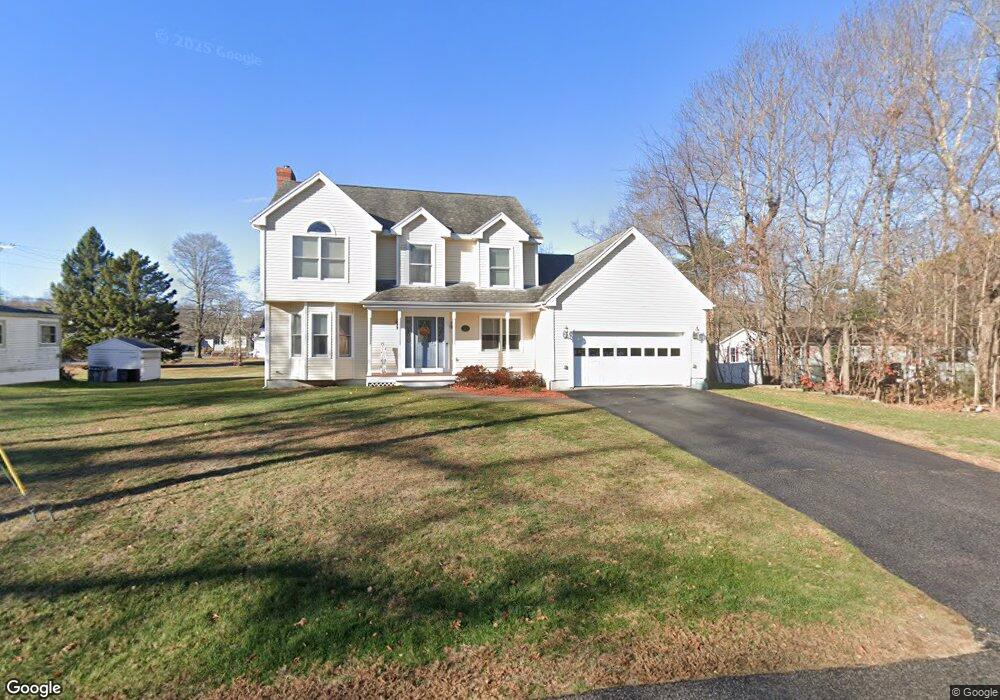
5 Acorn Dr Seabrook, NH 03874
Estimated Value: $677,990 - $745,000
3
Beds
3
Baths
2,070
Sq Ft
$337/Sq Ft
Est. Value
About This Home
This home is located at 5 Acorn Dr, Seabrook, NH 03874 and is currently estimated at $697,748, approximately $337 per square foot. 5 Acorn Dr is a home located in Rockingham County with nearby schools including Seabrook Elementary School, Seabrook Middle School, and Winnacunnet High School.
Ownership History
Date
Name
Owned For
Owner Type
Purchase Details
Closed on
Oct 9, 2014
Sold by
Felch Joshua J and Felch Kimberly A
Bought by
Felch Ft
Current Estimated Value
Create a Home Valuation Report for This Property
The Home Valuation Report is an in-depth analysis detailing your home's value as well as a comparison with similar homes in the area
Home Values in the Area
Average Home Value in this Area
Purchase History
| Date | Buyer | Sale Price | Title Company |
|---|---|---|---|
| Felch Ft | -- | -- |
Source: Public Records
Tax History Compared to Growth
Tax History
| Year | Tax Paid | Tax Assessment Tax Assessment Total Assessment is a certain percentage of the fair market value that is determined by local assessors to be the total taxable value of land and additions on the property. | Land | Improvement |
|---|---|---|---|---|
| 2024 | $6,662 | $568,400 | $219,000 | $349,400 |
| 2023 | $6,522 | $432,200 | $169,500 | $262,700 |
| 2022 | $5,727 | $432,200 | $169,500 | $262,700 |
| 2021 | $5,723 | $416,800 | $154,100 | $262,700 |
| 2020 | $5,374 | $336,500 | $123,300 | $213,200 |
| 2019 | $5,300 | $336,500 | $123,300 | $213,200 |
| 2018 | $5,301 | $326,200 | $113,000 | $213,200 |
| 2017 | $4,995 | $307,400 | $94,200 | $213,200 |
| 2016 | $4,546 | $307,400 | $94,200 | $213,200 |
| 2015 | $4,239 | $286,600 | $88,500 | $198,100 |
| 2014 | $4,384 | $287,100 | $88,500 | $198,600 |
| 2013 | $4,384 | $287,100 | $88,500 | $198,600 |
Source: Public Records
Map
Nearby Homes
- 22 Farm Ln
- 8 Kimberly Dr
- 14 Coleman Ct
- 20 Railroad Ave
- 38 Rocks Rd Unit 2
- 38 Rocks Rd Unit 1
- 57 Washington St
- 81 Elm Ct
- 176 Lower Collins St
- 28 Brooks Rd
- 35 Norman Rd
- 241 & 245 Lafayette Rd
- 1 Old Salt Dr
- 2 Collins St
- 106 Folly Mill Rd
- 46 Kensington Rd
- 51 Depot Rd
- 27 Cross Beach Rd
- 188 Lafayette Rd
- 312 S Main St