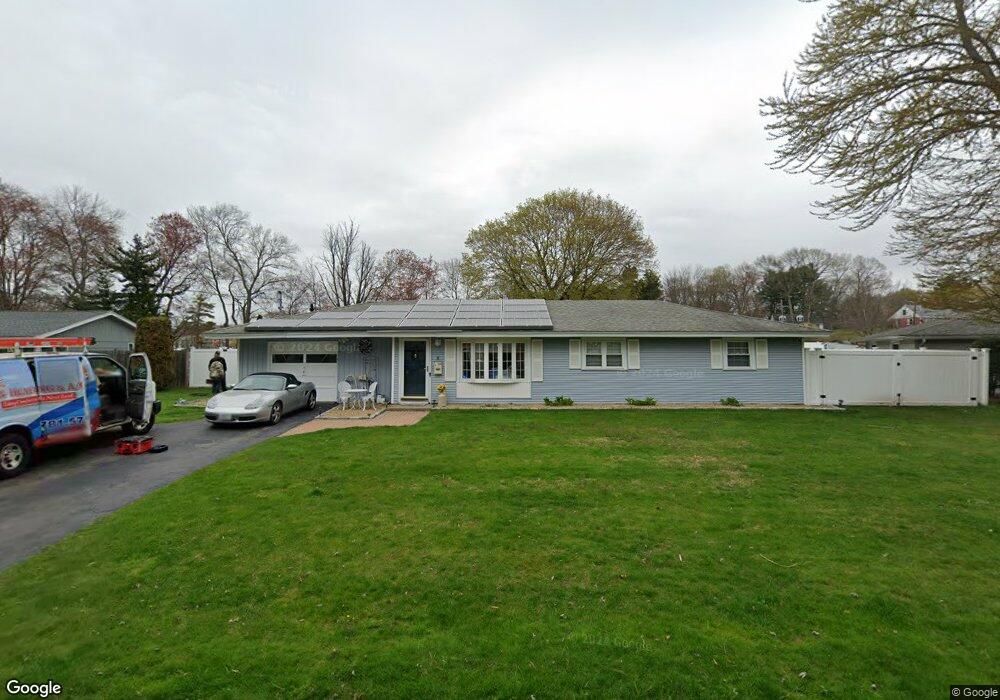
5 Alfred Rd Framingham, MA 01701
Saxonville NeighborhoodEstimated Value: $644,000 - $708,000
3
Beds
2
Baths
1,560
Sq Ft
$432/Sq Ft
Est. Value
About This Home
This home is located at 5 Alfred Rd, Framingham, MA 01701 and is currently estimated at $674,209, approximately $432 per square foot. 5 Alfred Rd is a home located in Middlesex County with nearby schools including Framingham High School, Christa McAuliffe Charter School, and MetroWest Jewish Day School.
Ownership History
Date
Name
Owned For
Owner Type
Purchase Details
Closed on
Mar 25, 2024
Sold by
Michael S Forman Ft and Forman
Bought by
Forman Ft and Forman
Current Estimated Value
Purchase Details
Closed on
Feb 6, 2019
Sold by
Forman Michael S and Forman Lisa M
Bought by
Michael S Forman Ft and Forman
Purchase Details
Closed on
Sep 12, 2012
Sold by
King Robert W
Bought by
Forman Michael S and Forman Lisa M
Home Financials for this Owner
Home Financials are based on the most recent Mortgage that was taken out on this home.
Original Mortgage
$294,500
Interest Rate
3.57%
Mortgage Type
New Conventional
Purchase Details
Closed on
Jul 6, 1988
Sold by
Jasrasaria Suresh
Bought by
King Robert W
Create a Home Valuation Report for This Property
The Home Valuation Report is an in-depth analysis detailing your home's value as well as a comparison with similar homes in the area
Home Values in the Area
Average Home Value in this Area
Purchase History
| Date | Buyer | Sale Price | Title Company |
|---|---|---|---|
| Forman Ft | -- | None Available | |
| Forman Ft | -- | None Available | |
| Michael S Forman Ft | -- | -- | |
| Michael S Forman Ft | -- | -- | |
| Forman Michael S | $310,000 | -- | |
| Forman Michael S | $310,000 | -- | |
| King Robert W | $168,000 | -- |
Source: Public Records
Mortgage History
| Date | Status | Borrower | Loan Amount |
|---|---|---|---|
| Previous Owner | Forman Michael S | $294,500 | |
| Previous Owner | King Robert W | $123,000 |
Source: Public Records
Tax History
| Year | Tax Paid | Tax Assessment Tax Assessment Total Assessment is a certain percentage of the fair market value that is determined by local assessors to be the total taxable value of land and additions on the property. | Land | Improvement |
|---|---|---|---|---|
| 2025 | $6,510 | $545,200 | $271,100 | $274,100 |
| 2024 | $6,351 | $509,700 | $242,200 | $267,500 |
| 2023 | $6,087 | $465,000 | $216,100 | $248,900 |
| 2022 | $5,774 | $420,200 | $196,100 | $224,100 |
| 2021 | $5,617 | $399,800 | $188,500 | $211,300 |
| 2020 | $5,505 | $367,500 | $171,300 | $196,200 |
| 2019 | $5,414 | $352,000 | $171,300 | $180,700 |
| 2018 | $5,456 | $334,300 | $164,900 | $169,400 |
| 2017 | $5,344 | $319,800 | $160,100 | $159,700 |
| 2016 | $5,231 | $301,000 | $160,100 | $140,900 |
| 2015 | $5,275 | $296,000 | $160,700 | $135,300 |
Source: Public Records
Map
Nearby Homes
Your Personal Tour Guide
Ask me questions while you tour the home.