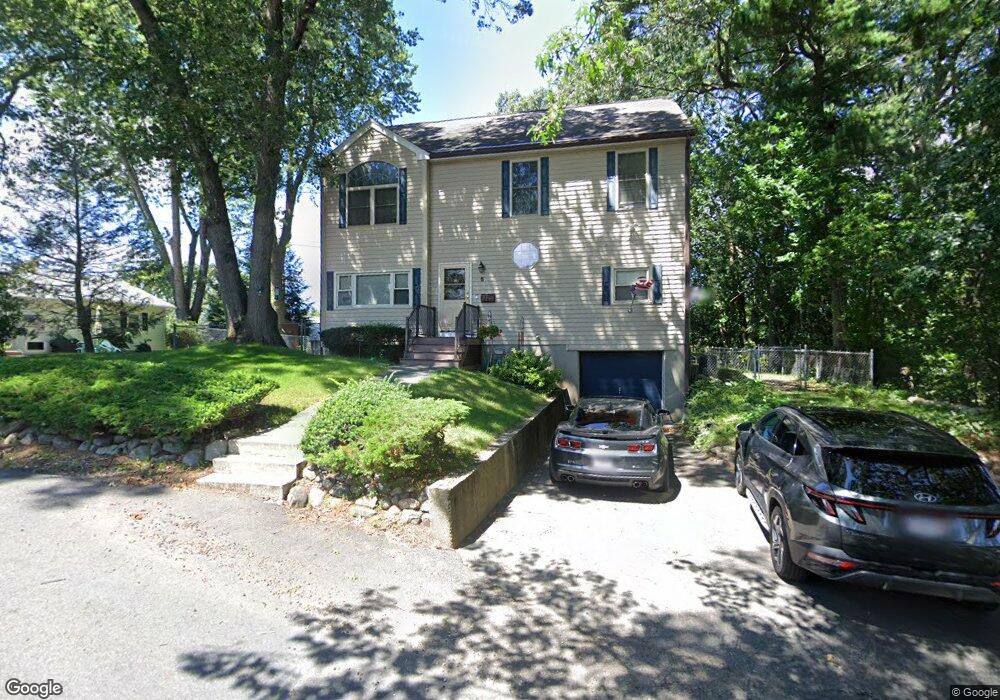
5 Alfred St Methuen, MA 01844
Downtown Methuen NeighborhoodEstimated Value: $600,000 - $669,000
3
Beds
2
Baths
2,657
Sq Ft
$236/Sq Ft
Est. Value
About This Home
This home is located at 5 Alfred St, Methuen, MA 01844 and is currently estimated at $626,911, approximately $235 per square foot. 5 Alfred St is a home located in Essex County with nearby schools including Mendota Elementary School, Tenney Grammar School, and South Point Elementary School.
Ownership History
Date
Name
Owned For
Owner Type
Purchase Details
Closed on
Apr 10, 2025
Sold by
Oneil
Bought by
Oneil
Current Estimated Value
Purchase Details
Closed on
Dec 5, 2012
Sold by
Oneil Patricia L and Oneil David B
Bought by
David & David Oneil Ret and Oneil
Purchase Details
Closed on
Jul 1, 1985
Bought by
Oneil David B and Oneil Patricia L
Create a Home Valuation Report for This Property
The Home Valuation Report is an in-depth analysis detailing your home's value as well as a comparison with similar homes in the area
Home Values in the Area
Average Home Value in this Area
Purchase History
| Date | Buyer | Sale Price | Title Company |
|---|---|---|---|
| Oneil | -- | None Available | |
| David & David Oneil Ret | -- | -- | |
| David & David Oneil Ret | -- | -- | |
| Oneil David B | -- | -- |
Source: Public Records
Mortgage History
| Date | Status | Borrower | Loan Amount |
|---|---|---|---|
| Previous Owner | David & David Oneil Ret | $108,850 |
Source: Public Records
Tax History Compared to Growth
Tax History
| Year | Tax Paid | Tax Assessment Tax Assessment Total Assessment is a certain percentage of the fair market value that is determined by local assessors to be the total taxable value of land and additions on the property. | Land | Improvement |
|---|---|---|---|---|
| 2025 | $5,264 | $497,500 | $202,600 | $294,900 |
| 2024 | $5,129 | $472,300 | $184,800 | $287,500 |
| 2023 | $4,926 | $421,000 | $164,300 | $256,700 |
| 2022 | $4,650 | $356,300 | $136,900 | $219,400 |
| 2021 | $4,371 | $331,400 | $130,000 | $201,400 |
| 2020 | $4,334 | $322,500 | $130,000 | $192,500 |
| 2019 | $4,109 | $289,600 | $116,400 | $173,200 |
| 2018 | $4,000 | $280,300 | $116,400 | $163,900 |
| 2017 | $3,888 | $265,400 | $116,400 | $149,000 |
| 2016 | $3,784 | $255,500 | $109,500 | $146,000 |
| 2015 | $3,643 | $249,500 | $109,500 | $140,000 |
Source: Public Records
Map
Nearby Homes
- 35 Memorial Dr
- 65 Clayton Ave
- 362 Lowell St
- 134 Haverhill St
- 2 Glen Forest Ln
- 8 Francella Rd
- 11 Vineyard Ln Unit 11
- 37 Maplewood Ave
- 945 Riverside Dr Unit 2A
- 17-19 Maplewood Ave
- 32 Glen Ave
- 190-192 Oakland Ave
- 197 Oakland Ave
- 14-16 Cypress Ave
- 88-90 Columbus Ave
- 57 Strathmore Rd
- 47 Hallenan Ave
- 2 Maurice Ave
- 68 Middlebury St
- 83 Arnold St