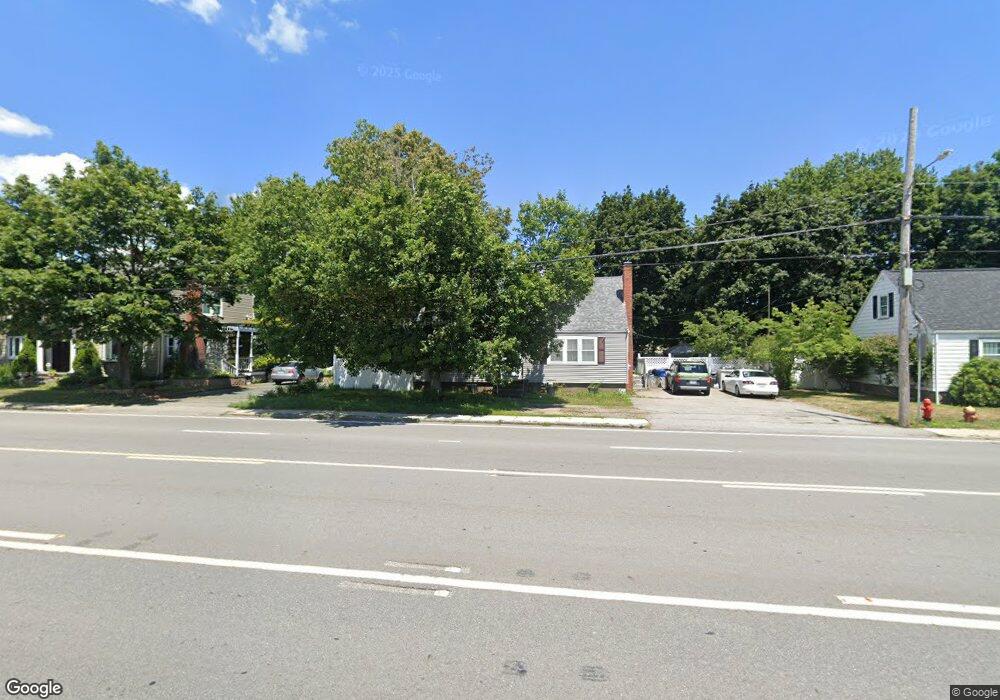
5 Andover St Danvers, MA 01923
Estimated Value: $526,000 - $646,000
4
Beds
1
Bath
1,296
Sq Ft
$441/Sq Ft
Est. Value
About This Home
This home is located at 5 Andover St, Danvers, MA 01923 and is currently estimated at $571,794, approximately $441 per square foot. 5 Andover St is a home located in Essex County with nearby schools including Danvers High School, St. Mary of the Annunciation School, and St John The Baptist School.
Ownership History
Date
Name
Owned For
Owner Type
Purchase Details
Closed on
Jan 9, 2004
Sold by
Three Cs Nt and Corbett
Bought by
Ibanez Jose L
Current Estimated Value
Purchase Details
Closed on
Nov 5, 1993
Sold by
James H Nolan Est and Thompson
Bought by
Three C'S Nt and Corbett
Home Financials for this Owner
Home Financials are based on the most recent Mortgage that was taken out on this home.
Original Mortgage
$90,000
Interest Rate
6.83%
Mortgage Type
Purchase Money Mortgage
Create a Home Valuation Report for This Property
The Home Valuation Report is an in-depth analysis detailing your home's value as well as a comparison with similar homes in the area
Home Values in the Area
Average Home Value in this Area
Purchase History
| Date | Buyer | Sale Price | Title Company |
|---|---|---|---|
| Ibanez Jose L | $210,000 | -- | |
| Three C'S Nt | $80,000 | -- |
Source: Public Records
Mortgage History
| Date | Status | Borrower | Loan Amount |
|---|---|---|---|
| Previous Owner | Three C'S Nt | $125,000 | |
| Previous Owner | Three C'S Nt | $125,000 | |
| Previous Owner | Three C'S Nt | $875,000 | |
| Previous Owner | Three C'S Nt | $90,000 |
Source: Public Records
Tax History
| Year | Tax Paid | Tax Assessment Tax Assessment Total Assessment is a certain percentage of the fair market value that is determined by local assessors to be the total taxable value of land and additions on the property. | Land | Improvement |
|---|---|---|---|---|
| 2025 | $4,922 | $447,900 | $240,100 | $207,800 |
| 2024 | $4,904 | $441,400 | $240,100 | $201,300 |
| 2023 | $4,606 | $392,000 | $220,100 | $171,900 |
| 2022 | $4,558 | $360,000 | $195,700 | $164,300 |
| 2021 | $4,503 | $337,300 | $195,700 | $141,600 |
| 2020 | $3,902 | $298,800 | $163,100 | $135,700 |
| 2019 | $3,935 | $296,300 | $163,100 | $133,200 |
| 2018 | $3,799 | $280,600 | $160,100 | $120,500 |
| 2017 | $3,538 | $249,300 | $136,000 | $113,300 |
| 2016 | $3,404 | $239,700 | $130,000 | $109,700 |
| 2015 | $3,484 | $233,700 | $130,000 | $103,700 |
Source: Public Records
Map
Nearby Homes
- 11 Andover St
- 97 Sylvan St Unit 7
- 22 Collins St Unit 31
- 57 Adams St
- 63 Adams St
- 152 Endicott St
- 10 Clark St
- 9 Ledgewood Way Unit 6
- 40 Centre St
- 8 Ledgewood Way Unit 20
- 108 Abington Rd Unit 108
- 500 Northshore Rd Unit 6B
- 4 Price Rd
- 14 Williams St Unit C17
- 3 Ledgewood Way Unit 8
- 23 Tamarack Ln Unit 23
- 28 Sabino Farm Rd
- 17 Bourbon St Unit 76
- 59 Nancy Ave
- 102 Centre St
Your Personal Tour Guide
Ask me questions while you tour the home.