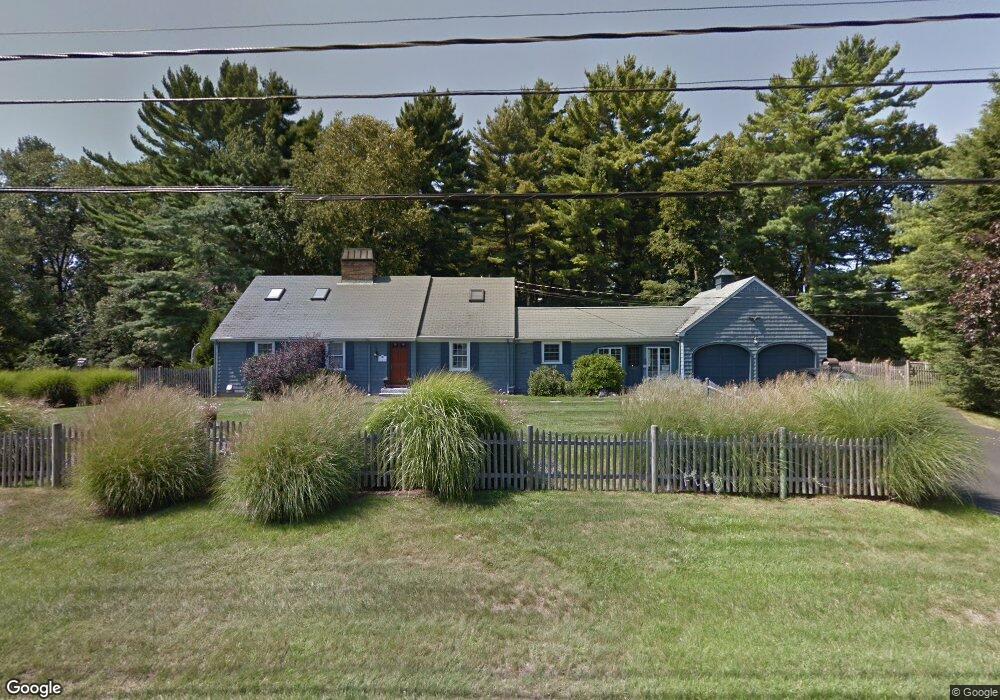
5 Apple Hill Ln Lynnfield, MA 01940
Estimated Value: $1,324,000 - $1,612,000
4
Beds
3
Baths
3,183
Sq Ft
$448/Sq Ft
Est. Value
About This Home
This home is located at 5 Apple Hill Ln, Lynnfield, MA 01940 and is currently estimated at $1,425,209, approximately $447 per square foot. 5 Apple Hill Ln is a home located in Essex County with nearby schools including Lynnfield Middle School, Pickering Middle School, and Lynnfield High School.
Ownership History
Date
Name
Owned For
Owner Type
Purchase Details
Closed on
Aug 12, 1996
Sold by
Lucaas Robert M
Bought by
Griffin Michael T
Current Estimated Value
Home Financials for this Owner
Home Financials are based on the most recent Mortgage that was taken out on this home.
Original Mortgage
$145,000
Interest Rate
8.24%
Mortgage Type
Purchase Money Mortgage
Purchase Details
Closed on
Oct 9, 1990
Sold by
Weisendanger John C
Bought by
Lucas Robert M
Purchase Details
Closed on
Jul 14, 1987
Sold by
Vanwinter Robert D
Bought by
Wiesendanger John C
Create a Home Valuation Report for This Property
The Home Valuation Report is an in-depth analysis detailing your home's value as well as a comparison with similar homes in the area
Home Values in the Area
Average Home Value in this Area
Purchase History
| Date | Buyer | Sale Price | Title Company |
|---|---|---|---|
| Griffin Michael T | $363,000 | -- | |
| Lucas Robert M | $349,900 | -- | |
| Lucas Robert M | $349,900 | -- | |
| Wiesendanger John C | $365,000 | -- |
Source: Public Records
Mortgage History
| Date | Status | Borrower | Loan Amount |
|---|---|---|---|
| Open | Wiesendanger John C | $300,000 | |
| Closed | Wiesendanger John C | $250,000 | |
| Closed | Griffin Michael T | $145,000 |
Source: Public Records
Tax History Compared to Growth
Tax History
| Year | Tax Paid | Tax Assessment Tax Assessment Total Assessment is a certain percentage of the fair market value that is determined by local assessors to be the total taxable value of land and additions on the property. | Land | Improvement |
|---|---|---|---|---|
| 2025 | $12,718 | $1,204,400 | $766,000 | $438,400 |
| 2024 | $12,291 | $1,169,500 | $743,700 | $425,800 |
| 2023 | $11,787 | $1,043,100 | $658,700 | $384,400 |
| 2022 | $11,350 | $946,600 | $616,200 | $330,400 |
| 2021 | $10,384 | $782,500 | $510,000 | $272,500 |
| 2020 | $10,228 | $734,800 | $463,300 | $271,500 |
| 2019 | $9,836 | $707,100 | $435,600 | $271,500 |
| 2018 | $9,730 | $707,100 | $435,600 | $271,500 |
| 2017 | $9,744 | $707,100 | $435,600 | $271,500 |
| 2016 | $10,745 | $741,000 | $435,600 | $305,400 |
| 2015 | $9,503 | $655,800 | $391,900 | $263,900 |
Source: Public Records
Map
Nearby Homes
- 16 W Tapley Rd
- 33 Wing Rd
- 6 Needham Rd
- 20 Pine Hill Rd
- 6 Ashley Ct
- 928 Main St
- 19 Fairway Ln
- 19 Fairway Ln Unit 53
- Beverly Plan at Willis Brook at Lynnfield
- Sutton Plan at Willis Brook at Lynnfield
- Topsfield Plan at Willis Brook at Lynnfield
- Westford Plan at Willis Brook at Lynnfield
- 1 Stableford Ct Unit 13
- 2 Bridle Path
- 1466 Main St
- 11 Hutchins Cir
- 4 Lowell St
- 15 Park St Unit A
- 15 Park St
- 35 Catherine Dr