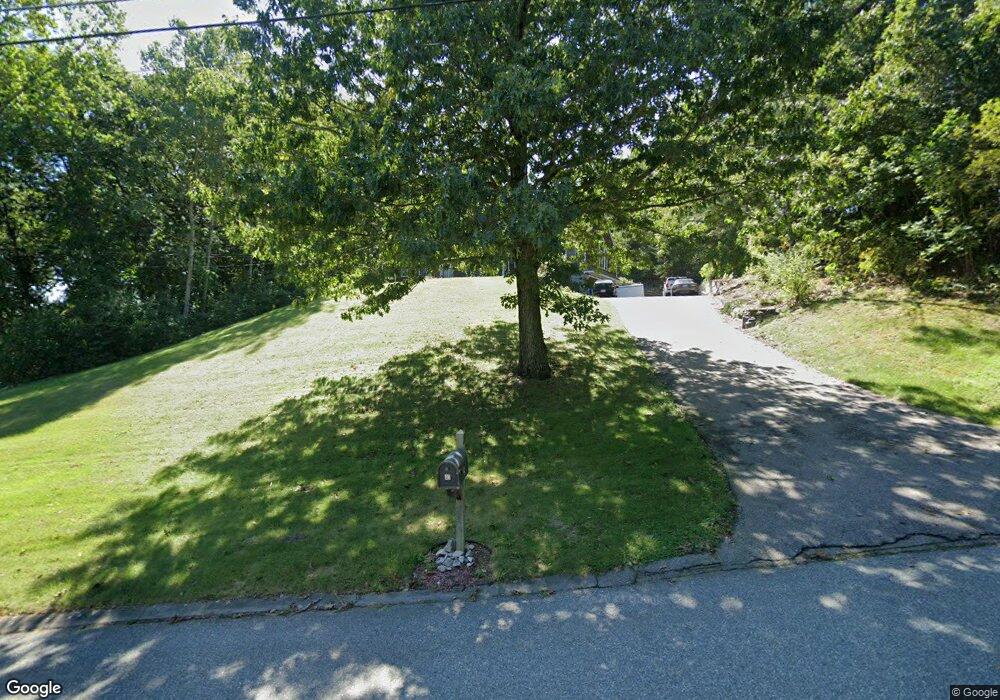
5 Arrowhead Rd Wrentham, MA 02093
Estimated Value: $756,000 - $938,000
4
Beds
3
Baths
2,905
Sq Ft
$287/Sq Ft
Est. Value
About This Home
This home is located at 5 Arrowhead Rd, Wrentham, MA 02093 and is currently estimated at $834,452, approximately $287 per square foot. 5 Arrowhead Rd is a home located in Norfolk County with nearby schools including Delaney Elementary School, Charles E Roderick, and Cadence Academy Preschool - North Attleborough.
Ownership History
Date
Name
Owned For
Owner Type
Purchase Details
Closed on
Dec 10, 1997
Sold by
Orleans Barry R and Orleans Lisa J
Bought by
Roman Christopher B and Roman Donna J
Current Estimated Value
Home Financials for this Owner
Home Financials are based on the most recent Mortgage that was taken out on this home.
Original Mortgage
$179,250
Interest Rate
7.14%
Mortgage Type
Purchase Money Mortgage
Purchase Details
Closed on
Oct 4, 1991
Sold by
Joel Construction Inc
Bought by
Orleans Barry R and Orleans Lisa J
Home Financials for this Owner
Home Financials are based on the most recent Mortgage that was taken out on this home.
Original Mortgage
$163,400
Interest Rate
9.08%
Mortgage Type
Purchase Money Mortgage
Create a Home Valuation Report for This Property
The Home Valuation Report is an in-depth analysis detailing your home's value as well as a comparison with similar homes in the area
Home Values in the Area
Average Home Value in this Area
Purchase History
| Date | Buyer | Sale Price | Title Company |
|---|---|---|---|
| Roman Christopher B | $239,000 | -- | |
| Orleans Barry R | $60,000 | -- |
Source: Public Records
Mortgage History
| Date | Status | Borrower | Loan Amount |
|---|---|---|---|
| Open | Orleans Barry R | $280,000 | |
| Closed | Orleans Barry R | $179,250 | |
| Previous Owner | Orleans Barry R | $163,400 | |
| Closed | Orleans Barry R | $35,850 |
Source: Public Records
Tax History Compared to Growth
Tax History
| Year | Tax Paid | Tax Assessment Tax Assessment Total Assessment is a certain percentage of the fair market value that is determined by local assessors to be the total taxable value of land and additions on the property. | Land | Improvement |
|---|---|---|---|---|
| 2025 | $7,850 | $677,300 | $277,700 | $399,600 |
| 2024 | $7,529 | $627,400 | $277,700 | $349,700 |
| 2023 | $7,325 | $580,400 | $252,800 | $327,600 |
| 2022 | $7,044 | $515,300 | $227,900 | $287,400 |
| 2021 | $6,593 | $468,600 | $204,100 | $264,500 |
| 2020 | $6,669 | $468,000 | $186,600 | $281,400 |
| 2019 | $6,429 | $455,300 | $186,600 | $268,700 |
| 2018 | $7,389 | $518,900 | $177,700 | $341,200 |
| 2017 | $7,185 | $504,200 | $174,300 | $329,900 |
| 2016 | $7,093 | $496,700 | $169,200 | $327,500 |
| 2015 | $7,063 | $471,500 | $162,700 | $308,800 |
| 2014 | $6,946 | $453,700 | $156,500 | $297,200 |
Source: Public Records
Map
Nearby Homes
- 120 Hawes St
- 483 Thurston St
- 155 Clark Rd Unit 155
- 319 Taunton St
- 65 Pond St
- 362 East St
- 9 Oak Dr
- 16 Treasure Island Rd
- 80 Mill St
- 1 Lorraine Metcalf Dr
- 10 Nature View Dr
- 15 Nature View Dr
- 270 Dedham St
- 126 Washington St
- 130 Washington St
- 124 Washington St
- 158 Washington St
- 11 Earle Stewart Ln
- Lot 1 - Blueberry 2 Car Plan at King Philip Estates
- Lot 8 - Blueberry 2 Car Plan at King Philip Estates
- 15 Arrowhead Rd
- 60 Arrowhead Rd
- 170 Hawes St
- 180 Hawes St
- 150 Hawes St
- 10 Arrowhead Rd
- 25 Arrowhead Rd
- 190 Hawes St
- 140 Hawes St
- 20 Arrowhead Rd
- 130 Hawes St
- 30 Arrowhead Rd
- 55 Arrowhead Rd
- 40 Arrowhead Rd
- 40 Arrowhead Rd Unit 40
- 115 Hawes St
- 560 Washington St
- 560 Washington St Unit 2
- 560 Washington St Unit 3
- 560 Washington St Unit 3A