
Seller's Agent in 2025
Stephen DeStefano
Century 21 Circa 72 Inc.
(603) 496-3674
49 in this area
107 Total Sales
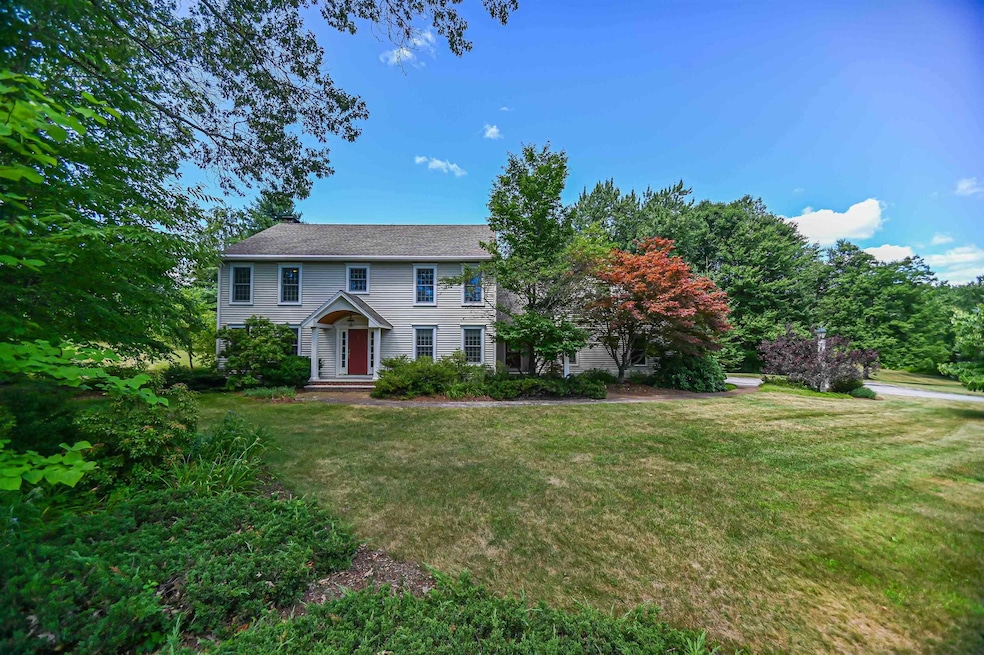


OFFER DEADLINE MONDAY 8/4 @ 5:00pm.Welcome to 5 Asa Drive. This 4 bedroom, 3 bath Colonial has been lovingly maintained by the original owners .You will feel at home as soon as you step into the light -filled Foyer which opens to both the Living Room and Dining Room with gorgeous hardwood floors. The Family Room with wood burning fireplace is surrounded by built-in bookcases and opens into the Great Room with vaulted ceiling and and a cozy window-seat. The spacious Kitchen offers an island for food prep or casual eating as well as a separate eating area. In addition, a formal Dining Room is a perfect space for gathering and entertaining. Convenient Laundry is located in the Mudroom which has direct access to both the outside and the 2 car garage A half Bathroom completes the first floor. Upstairs are 4 large Bedrooms , a Full Bath and the Primary Suite with hardwood , double closets and Full Bath. Looking for more space? Head to the lower level with 720 SF of finished bonus area! This house provides plenty of storage in the basement and above the garage. The 2.16 landscaped acres have been organically maintained by the owners. This home is located in an established neighborhood, close to the desirable Bow schools, highways, conservation trails and is 16 miles to Manchester-Boston Regional Airport .The owners have taken care of many "big ticket" updates, including heating system , roof & water systems. This is a must-see! Delayed showings start Wednesday July 30th.
Last Agent to Sell the Property
Century 21 Circa 72 Inc. License #011685 Listed on: 07/27/2025
| Date | Type | Sale Price | Title Company |
|---|---|---|---|
| Warranty Deed | $760,000 | -- | |
| Warranty Deed | $760,000 | -- | |
| Warranty Deed | -- | None Available | |
| Warranty Deed | -- | None Available | |
| Warranty Deed | $205,500 | -- | |
| Warranty Deed | $205,500 | -- |
| Date | Status | Loan Amount | Loan Type |
|---|---|---|---|
| Open | $325,000 | New Conventional | |
| Closed | $325,000 | New Conventional | |
| Previous Owner | $140,000 | Purchase Money Mortgage |
| Date | Event | Price | List to Sale | Price per Sq Ft |
|---|---|---|---|---|
| 09/05/2025 09/05/25 | Sold | $760,000 | +6.3% | $228 / Sq Ft |
| 07/27/2025 07/27/25 | For Sale | $715,000 | -- | $215 / Sq Ft |
| Year | Tax Paid | Tax Assessment Tax Assessment Total Assessment is a certain percentage of the fair market value that is determined by local assessors to be the total taxable value of land and additions on the property. | Land | Improvement |
|---|---|---|---|---|
| 2024 | $13,164 | $665,500 | $156,100 | $509,400 |
| 2023 | $11,753 | $422,600 | $103,900 | $318,700 |
| 2022 | $11,207 | $422,600 | $103,900 | $318,700 |
| 2021 | $10,772 | $422,600 | $103,900 | $318,700 |
| 2020 | $10,810 | $422,600 | $103,900 | $318,700 |
| 2019 | $11,076 | $422,600 | $103,900 | $318,700 |
| 2018 | $10,479 | $377,200 | $95,200 | $282,000 |
| 2017 | $10,475 | $377,200 | $95,200 | $282,000 |
| 2016 | $9,917 | $377,200 | $95,200 | $282,000 |
| 2015 | $9,806 | $343,600 | $95,200 | $248,400 |
| 2014 | $10,140 | $343,600 | $95,200 | $248,400 |
| 2011 | $9,006 | $331,700 | $95,200 | $236,500 |
Seller's Agent in 2025
Stephen DeStefano
Century 21 Circa 72 Inc.
(603) 496-3674
49 in this area
107 Total Sales
Buyer's Agent in 2025
Louis Nixon
BHG Masiello Bedford
(603) 234-4018
3 in this area
120 Total Sales
Source: PrimeMLS
MLS Number: 5053643
APN: BOWW-000039-000002-000125-R000000
Disclaimer: Certain information contained herein is derived from information provided by parties other than Homes.com. All information provided is deemed reliable, but is not guaranteed to be accurate and should be independently verified.
![]() Copyright 2026 PrimeMLS, Inc. All rights reserved. This information is deemed reliable, but not guaranteed. The data relating to real estate displayed on this display comes in part from the IDX Program of PrimeMLS. The information being provided is for consumers’ personal, non-commercial use and may not be used for any purpose other than to identify prospective properties consumers may be interested in purchasing.
Copyright 2026 PrimeMLS, Inc. All rights reserved. This information is deemed reliable, but not guaranteed. The data relating to real estate displayed on this display comes in part from the IDX Program of PrimeMLS. The information being provided is for consumers’ personal, non-commercial use and may not be used for any purpose other than to identify prospective properties consumers may be interested in purchasing.
Ask me questions while you tour the home.