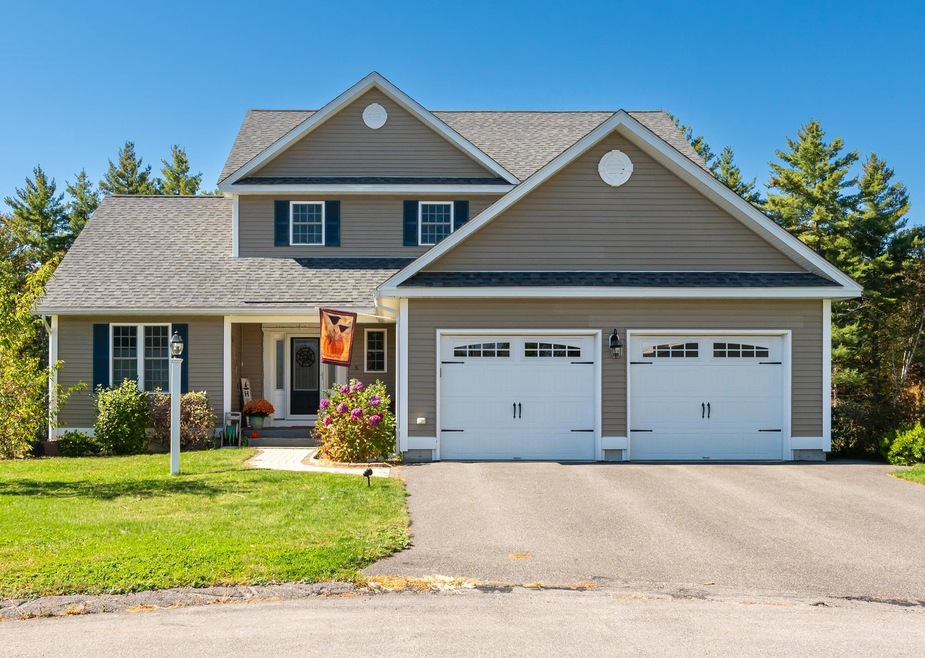
5 Barbie Ct MerriMacK, NH 03054
Estimated payment $5,122/month
Highlights
- Spa
- Colonial Architecture
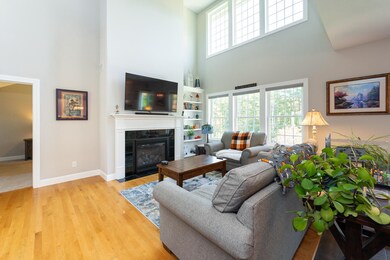
- Cathedral Ceiling
- Reeds Ferry School Rated 9+
- Deck
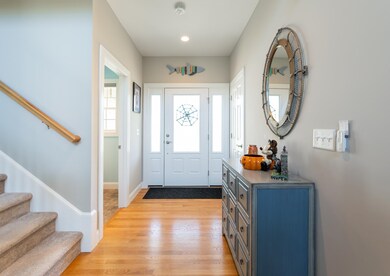
- Wood Flooring
About This Home
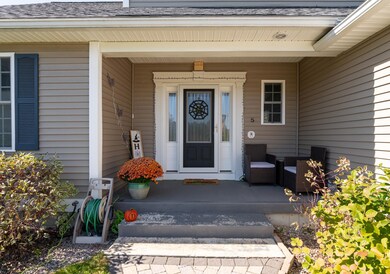
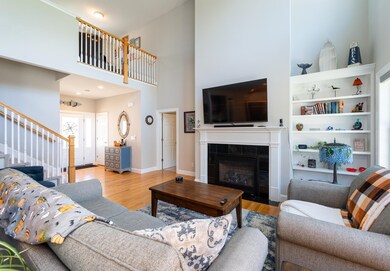
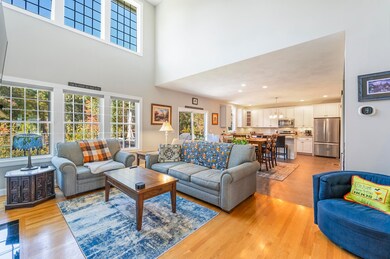
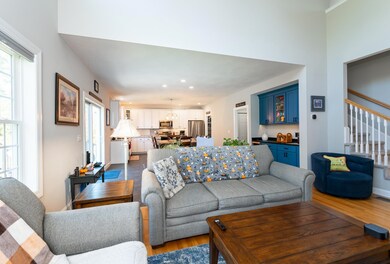
This stunning 3-bedroom, 2.5-bath home is tucked away at the end of a quiet cul-de-sac, offering both privacy and a convenient commuter location. Inside, you’ll find soaring 9’ ceilings and a vaulted-ceiling living room centered around a cozy gas fireplace. The spacious kitchen is a true showstopper with a center island, walk-in pantry, and beverage center—perfect for entertaining. The first-floor primary suite includes a walk-in closet and a large bath with a step-in shower. A dedicated first floor laundry room adds everyday convenience.
Upstairs, two additional bedrooms share a Jack and Jill full bath, while a large loft area provides flexible space for a home office or den. Outdoor living shines with a large Trex deck and hot tub, ideal for relaxing or hosting guests in the fenced in yard. With its thoughtful layout and desirable features, this home is designed to elevate everyday living.
Listing Agent
BHHS Verani Nashua Brokerage Phone: 603-305-3913 License #069633 Listed on: 10/09/2025

Home Details
Home Type
- Single Family
Est. Annual Taxes
- $12,453
Year Built
- Built in 2018
Lot Details
- 0.64 Acre Lot
Parking
- 2 Car Garage
Home Design
- Colonial Architecture
- Wood Frame Construction
Interior Spaces
- Property has 2 Levels
- Cathedral Ceiling
- Ceiling Fan
- Fireplace
- Living Room
- Loft
Kitchen
- Walk-In Pantry
- Gas Range
- Microwave
- Dishwasher
- Kitchen Island
Flooring
- Wood
- Carpet
- Vinyl
Bedrooms and Bathrooms
- 3 Bedrooms
- Main Floor Bedroom
- En-Suite Bathroom
- Walk-In Closet
Laundry
- Laundry Room
- Laundry on main level
Basement
- Basement Fills Entire Space Under The House
- Walk-Up Access
Accessible Home Design
- Accessible Full Bathroom
- Hard or Low Nap Flooring
Outdoor Features
- Spa
- Deck
Schools
- Reeds Ferry Elementary School
- Merrimack Middle School
- Merrimack High School
Utilities
- Forced Air Heating and Cooling System
- Cable TV Available
Listing and Financial Details
- Legal Lot and Block 000009 / 000047
- Assessor Parcel Number 00006D
Map
Home Values in the Area
Average Home Value in this Area
Tax History
| Year | Tax Paid | Tax Assessment Tax Assessment Total Assessment is a certain percentage of the fair market value that is determined by local assessors to be the total taxable value of land and additions on the property. | Land | Improvement |
|---|---|---|---|---|
| 2024 | $12,453 | $601,900 | $232,000 | $369,900 |
| 2023 | $11,643 | $598,600 | $232,000 | $366,600 |
| 2022 | $10,404 | $598,600 | $232,000 | $366,600 |
| 2021 | $10,708 | $598,600 | $232,000 | $366,600 |
| 2020 | $10,346 | $430,000 | $162,100 | $267,900 |
| 2019 | $10,376 | $430,000 | $162,100 | $267,900 |
| 2018 | $3,910 | $162,100 | $162,100 | $0 |
| 2017 | $2,274 | $97,300 | $97,300 | $0 |
| 2016 | $2,217 | $97,300 | $97,300 | $0 |
| 2015 | $2,887 | $116,800 | $116,800 | $0 |
| 2014 | $2,814 | $116,800 | $116,800 | $0 |
Property History
| Date | Event | Price | List to Sale | Price per Sq Ft |
|---|---|---|---|---|
| 10/09/2025 10/09/25 | For Sale | $775,000 | -- | $349 / Sq Ft |
Purchase History
| Date | Type | Sale Price | Title Company |
|---|---|---|---|
| Quit Claim Deed | -- | None Available | |
| Warranty Deed | $457,400 | -- | |
| Warranty Deed | $457,400 | -- |
Mortgage History
| Date | Status | Loan Amount | Loan Type |
|---|---|---|---|
| Previous Owner | $388,738 | No Value Available |
Source: PrimeMLS
MLS Number: 5064999
APN: MRMK-000006D-000047-000009
Disclaimer: Certain information contained herein is derived from information provided by parties other than Homes.com. All information provided is deemed reliable, but is not guaranteed to be accurate and should be independently verified.
![]() Copyright 2025 PrimeMLS, Inc. All rights reserved. This information is deemed reliable, but not guaranteed. The data relating to real estate displayed on this display comes in part from the IDX Program of PrimeMLS. The information being provided is for consumers’ personal, non-commercial use and may not be used for any purpose other than to identify prospective properties consumers may be interested in purchasing.
Copyright 2025 PrimeMLS, Inc. All rights reserved. This information is deemed reliable, but not guaranteed. The data relating to real estate displayed on this display comes in part from the IDX Program of PrimeMLS. The information being provided is for consumers’ personal, non-commercial use and may not be used for any purpose other than to identify prospective properties consumers may be interested in purchasing.
- 80 Wire Rd
- 38 Mallard Point
- 8 Donovan Ct
- 29 Bedford Rd
- 16 Summit Rd
- 20 Summit Rd
- 19 Vista Way
- 53 Barnside Dr
- 56 Greenfield Pkwy
- 22 Clay St
- 18 Horizon Dr
- 1 Pleasant St
- 98 Indian Rock Rd
- 10 Kingston Ct Unit 10
- 22 Essex Green Ct
- 11 Essex Green Ct
- 12 Clinton Ct
- 33 Hillside Terrace
- 40 Seton Dr
- 3 Independence Dr
- 185 Indian Rock Rd
- 10 Center St
- 3 Gilbert Dr
- 4 Twin Bridge Rd
- 19A Loop Rd
- 17 Powderhouse Rd
- 540 Charles Bancroft Hwy Unit 4Belg
- 15 Iron Horse Dr
- 360 Daniel Webster Hwy
- 49 Technology Dr
- 334 S River Rd
- 216 County Rd
- 2 Bow Ln
- 6 Dutch Dr
- 1 Vanderbilt Dr
- 2 Executive Park Dr
- 66 Hawthorne Dr
- 37 Hawthorne Dr
- 38 Hawthorne Dr
- 246 Daniel Webster Hwy