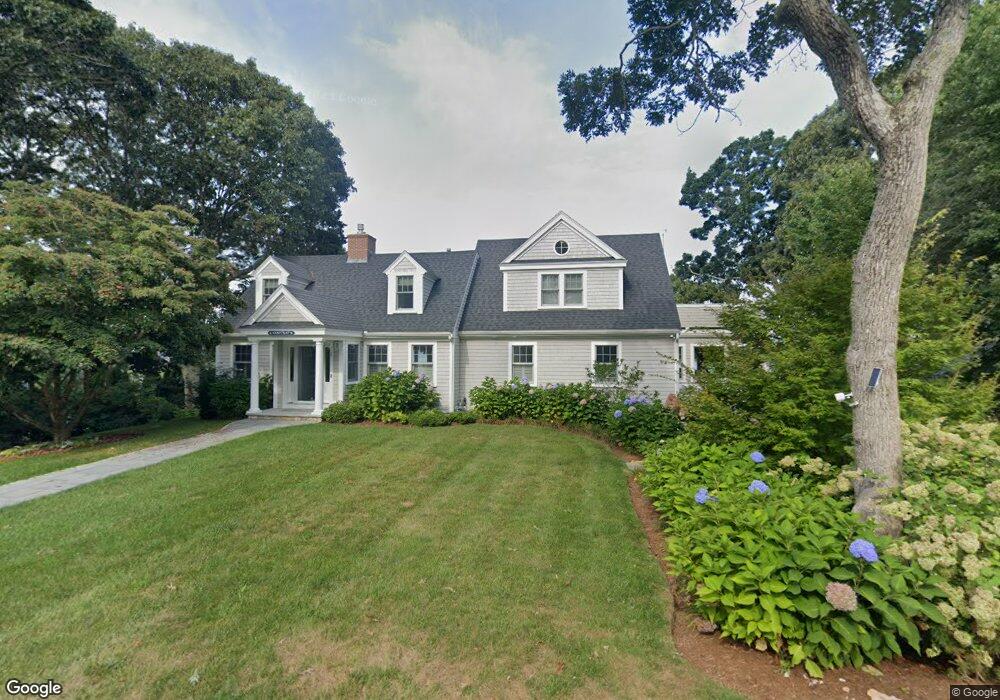
5 Bayside Ln Bourne, MA 02559
Pocasset NeighborhoodEstimated Value: $1,106,000 - $2,331,725
4
Beds
2
Baths
2,391
Sq Ft
$728/Sq Ft
Est. Value
About This Home
This home is located at 5 Bayside Ln, Bourne, MA 02559 and is currently estimated at $1,740,181, approximately $727 per square foot. 5 Bayside Ln is a home located in Barnstable County with nearby schools including Bourne High School, Cadence Academy Preschool - Bourne, and St Margaret Regional School.
Ownership History
Date
Name
Owned For
Owner Type
Purchase Details
Closed on
Dec 21, 2017
Sold by
Leibowitz Kenneth A and Leibowitz Sandra L
Bought by
Sll Lt and Leibowitz
Current Estimated Value
Purchase Details
Closed on
Aug 23, 2010
Sold by
Lodge Richard B
Bought by
Leibowitz Kenneth A and Leibowitz Sandra L
Home Financials for this Owner
Home Financials are based on the most recent Mortgage that was taken out on this home.
Original Mortgage
$580,000
Interest Rate
4.63%
Mortgage Type
Purchase Money Mortgage
Create a Home Valuation Report for This Property
The Home Valuation Report is an in-depth analysis detailing your home's value as well as a comparison with similar homes in the area
Home Values in the Area
Average Home Value in this Area
Purchase History
| Date | Buyer | Sale Price | Title Company |
|---|---|---|---|
| Sll Lt | -- | -- | |
| Sll Lt | -- | -- | |
| Leibowitz Kenneth A | $725,000 | -- | |
| Leibowitz Kenneth A | $725,000 | -- |
Source: Public Records
Mortgage History
| Date | Status | Borrower | Loan Amount |
|---|---|---|---|
| Previous Owner | Leibowitz Kenneth A | $570,000 | |
| Previous Owner | Leibowitz Kenneth A | $580,000 |
Source: Public Records
Tax History
| Year | Tax Paid | Tax Assessment Tax Assessment Total Assessment is a certain percentage of the fair market value that is determined by local assessors to be the total taxable value of land and additions on the property. | Land | Improvement |
|---|---|---|---|---|
| 2025 | $16,825 | $2,154,300 | $1,285,700 | $868,600 |
| 2024 | $15,945 | $1,988,200 | $1,224,400 | $763,800 |
| 2023 | $15,543 | $1,764,200 | $1,083,600 | $680,600 |
| 2022 | $15,202 | $1,506,600 | $958,900 | $547,700 |
| 2021 | $14,820 | $1,376,000 | $872,700 | $503,300 |
| 2020 | $14,317 | $1,333,100 | $864,400 | $468,700 |
| 2019 | $13,767 | $1,309,900 | $864,400 | $445,500 |
| 2018 | $13,174 | $1,249,900 | $823,300 | $426,600 |
| 2017 | $11,682 | $1,134,200 | $715,400 | $418,800 |
| 2016 | $10,705 | $1,053,600 | $715,400 | $338,200 |
| 2015 | $8,569 | $850,900 | $701,100 | $149,800 |
Source: Public Records
Map
Nearby Homes
- 14 Navajo Rd
- 254 Barlows Landing Rd
- 566 Shore Rd
- 16 Michael Rd
- 174 Barlows Landing Rd
- 14 Virginia Rd
- 6 Andrea Rd
- 8 Elizabeth Rd
- 3 1st St
- 3 4th Ave
- 7 4th Ave
- 10 Howard Ave
- 10 Howard Ave
- 21 Club House Dr
- 23 Club House Dr
- 1 Hawthorne Ct Unit C
- 135 Leeward Rd
- 77 Roundhouse Rd Unit 77
- 1090 Shore Rd Unit 7
- 119 Valley Bars Rd
Your Personal Tour Guide
Ask me questions while you tour the home.