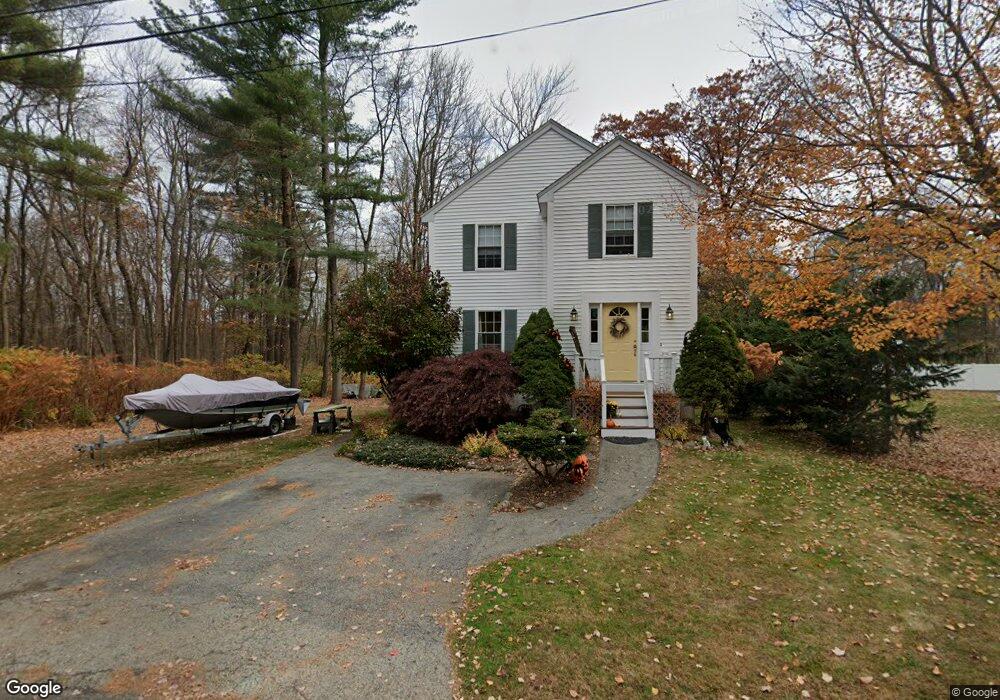
5 Belmore Rd Merrimac, MA 01860
Estimated Value: $569,000 - $661,000
3
Beds
2
Baths
1,320
Sq Ft
$468/Sq Ft
Est. Value
About This Home
This home is located at 5 Belmore Rd, Merrimac, MA 01860 and is currently estimated at $617,757, approximately $467 per square foot. 5 Belmore Rd is a home located in Essex County with nearby schools including Pentucket Regional High School.
Ownership History
Date
Name
Owned For
Owner Type
Purchase Details
Closed on
Mar 23, 2001
Sold by
Waterhouse Richard A
Bought by
Dacey Patrick C and Dacey Barbara J
Current Estimated Value
Home Financials for this Owner
Home Financials are based on the most recent Mortgage that was taken out on this home.
Original Mortgage
$223,155
Interest Rate
6.93%
Mortgage Type
Purchase Money Mortgage
Purchase Details
Closed on
Apr 28, 2000
Sold by
Dam Daniel B
Bought by
Waterhouse Richard A
Create a Home Valuation Report for This Property
The Home Valuation Report is an in-depth analysis detailing your home's value as well as a comparison with similar homes in the area
Home Values in the Area
Average Home Value in this Area
Purchase History
| Date | Buyer | Sale Price | Title Company |
|---|---|---|---|
| Dacey Patrick C | $234,900 | -- | |
| Waterhouse Richard A | $65,000 | -- |
Source: Public Records
Mortgage History
| Date | Status | Borrower | Loan Amount |
|---|---|---|---|
| Open | Waterhouse Richard A | $32,200 | |
| Open | Waterhouse Richard A | $260,000 | |
| Closed | Waterhouse Richard A | $230,000 | |
| Closed | Waterhouse Richard A | $223,155 |
Source: Public Records
Tax History Compared to Growth
Tax History
| Year | Tax Paid | Tax Assessment Tax Assessment Total Assessment is a certain percentage of the fair market value that is determined by local assessors to be the total taxable value of land and additions on the property. | Land | Improvement |
|---|---|---|---|---|
| 2025 | $6,592 | $497,500 | $270,700 | $226,800 |
| 2024 | $6,253 | $463,200 | $238,800 | $224,400 |
| 2023 | $5,896 | $399,200 | $213,300 | $185,900 |
| 2022 | $5,578 | $341,400 | $184,700 | $156,700 |
| 2021 | $5,045 | $309,500 | $152,800 | $156,700 |
| 2020 | $4,605 | $309,500 | $152,800 | $156,700 |
| 2019 | $4,373 | $276,600 | $127,400 | $149,200 |
| 2018 | $4,310 | $273,500 | $127,400 | $146,100 |
| 2017 | $4,078 | $249,600 | $108,300 | $141,300 |
| 2016 | $3,983 | $246,500 | $108,300 | $138,200 |
| 2015 | $3,775 | $232,300 | $105,100 | $127,200 |
| 2014 | $3,691 | $232,300 | $105,100 | $127,200 |
Source: Public Records
Map
Nearby Homes