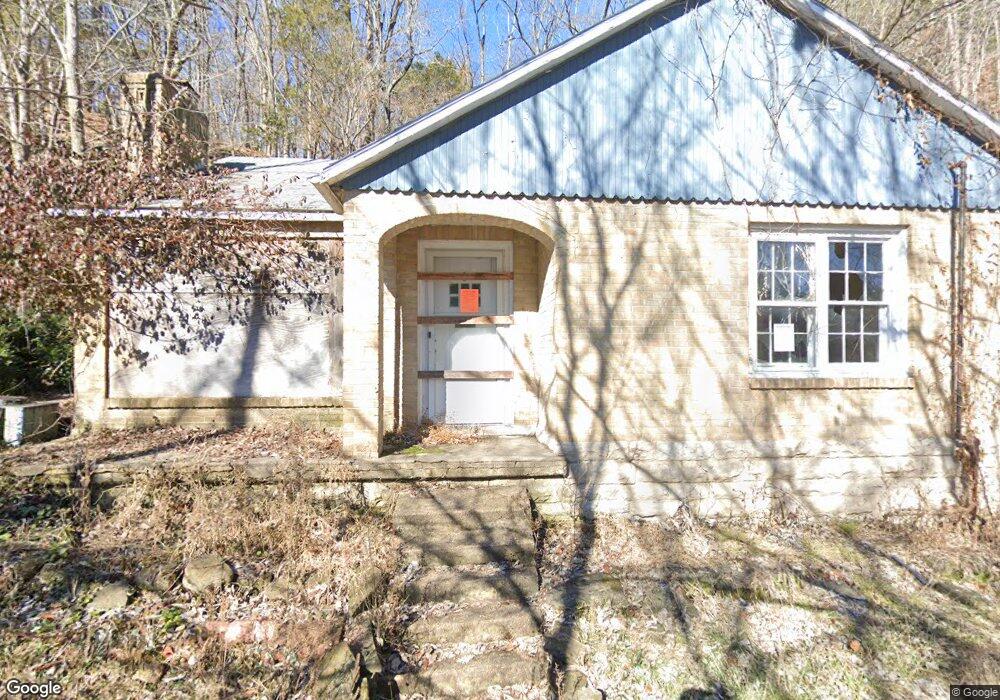
5 Benton St Eureka Springs, AR 72632
Estimated Value: $185,810 - $315,000
--
Bed
1
Bath
1,080
Sq Ft
$227/Sq Ft
Est. Value
About This Home
This home is located at 5 Benton St, Eureka Springs, AR 72632 and is currently estimated at $245,453, approximately $227 per square foot. 5 Benton St is a home located in Carroll County with nearby schools including Eureka Springs Elementary School, Eureka Springs Middle School, and Eureka Springs High School.
Ownership History
Date
Name
Owned For
Owner Type
Purchase Details
Closed on
Feb 14, 2023
Sold by
Commissioner Of State Lands
Bought by
Mcleod Euan and Mcleod Kristy
Current Estimated Value
Purchase Details
Closed on
Apr 28, 2004
Sold by
Graham
Bought by
Mcleod
Purchase Details
Closed on
Nov 18, 2002
Sold by
Riker
Bought by
Graham
Purchase Details
Closed on
Sep 25, 1996
Sold by
Dillow
Bought by
Riker
Purchase Details
Closed on
Oct 1, 1992
Sold by
Not Provided
Bought by
Not Provided
Purchase Details
Closed on
Jul 3, 1985
Bought by
From Robert Dillow
Create a Home Valuation Report for This Property
The Home Valuation Report is an in-depth analysis detailing your home's value as well as a comparison with similar homes in the area
Home Values in the Area
Average Home Value in this Area
Purchase History
| Date | Buyer | Sale Price | Title Company |
|---|---|---|---|
| Mcleod Euan | $996 | -- | |
| Mcleod Euan | $996 | None Listed On Document | |
| Mcleod | $97,000 | -- | |
| Graham | $70,000 | -- | |
| Riker | $77,000 | -- | |
| Not Provided | -- | -- | |
| From Robert Dillow | -- | -- |
Source: Public Records
Tax History Compared to Growth
Tax History
| Year | Tax Paid | Tax Assessment Tax Assessment Total Assessment is a certain percentage of the fair market value that is determined by local assessors to be the total taxable value of land and additions on the property. | Land | Improvement |
|---|---|---|---|---|
| 2024 | $303 | $6,000 | $6,000 | $0 |
| 2023 | $303 | $6,000 | $6,000 | $0 |
| 2022 | $278 | $6,000 | $6,000 | $0 |
| 2021 | $253 | $5,000 | $5,000 | $0 |
| 2020 | $253 | $5,000 | $5,000 | $0 |
| 2019 | $271 | $5,000 | $5,000 | $0 |
| 2018 | $271 | $5,000 | $5,000 | $0 |
| 2017 | $271 | $5,000 | $5,000 | $0 |
| 2016 | $1,120 | $22,160 | $4,000 | $18,160 |
| 2015 | $1,120 | $22,160 | $4,000 | $18,160 |
| 2014 | -- | $22,160 | $4,000 | $18,160 |
Source: Public Records
Map
Nearby Homes