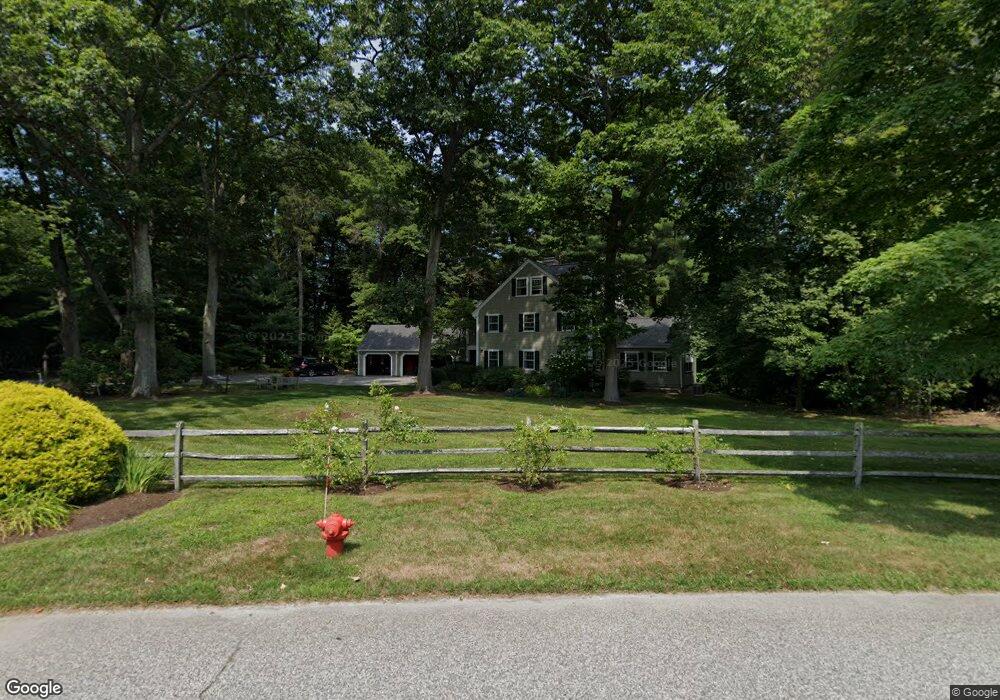
5 Boardman Ln South Hamilton, MA 01982
Estimated Value: $1,589,664 - $2,280,000
6
Beds
4
Baths
3,596
Sq Ft
$528/Sq Ft
Est. Value
About This Home
This home is located at 5 Boardman Ln, South Hamilton, MA 01982 and is currently estimated at $1,899,666, approximately $528 per square foot. 5 Boardman Ln is a home located in Essex County with nearby schools including Winthrop School, Cutler Elementary School, and Bessie Buker Elementary School.
Ownership History
Date
Name
Owned For
Owner Type
Purchase Details
Closed on
Nov 1, 2006
Sold by
Bachelder Hope A and Bachelder Robert A
Bought by
Wanger E David and Wanger Amy G
Current Estimated Value
Purchase Details
Closed on
Jan 10, 1989
Sold by
Baker L Alimenti
Bought by
Bachelder Robert A
Create a Home Valuation Report for This Property
The Home Valuation Report is an in-depth analysis detailing your home's value as well as a comparison with similar homes in the area
Home Values in the Area
Average Home Value in this Area
Purchase History
| Date | Buyer | Sale Price | Title Company |
|---|---|---|---|
| Wanger E David | $1,292,500 | -- | |
| Bachelder Robert A | $460,000 | -- | |
| Bachelder Robert A | $460,000 | -- |
Source: Public Records
Mortgage History
| Date | Status | Borrower | Loan Amount |
|---|---|---|---|
| Open | Bachelder Robert A | $300,000 | |
| Closed | Bachelder Robert A | $400,000 |
Source: Public Records
Tax History
| Year | Tax Paid | Tax Assessment Tax Assessment Total Assessment is a certain percentage of the fair market value that is determined by local assessors to be the total taxable value of land and additions on the property. | Land | Improvement |
|---|---|---|---|---|
| 2025 | $22,635 | $1,446,300 | $463,200 | $983,100 |
| 2024 | $21,530 | $1,424,900 | $463,200 | $961,700 |
| 2023 | $20,177 | $1,234,800 | $402,400 | $832,400 |
| 2022 | $17,483 | $977,800 | $367,200 | $610,600 |
| 2021 | $17,121 | $977,800 | $367,200 | $610,600 |
| 2020 | $17,432 | $1,026,600 | $367,300 | $659,300 |
| 2019 | $16,556 | $1,004,600 | $356,400 | $648,200 |
| 2018 | $15,466 | $953,500 | $336,200 | $617,300 |
| 2017 | $15,917 | $946,900 | $367,900 | $579,000 |
| 2016 | $15,999 | $927,500 | $364,900 | $562,600 |
Source: Public Records
Map
Nearby Homes
- Lot 0 Meyer Ln
- 598 Bay Rd
- 4 Bridge St
- 7 Bridge St
- 5 Bridge St
- 30 Autumn Ln
- Zero Bridge Street Lot Eight
- 2 Spingler Dr
- 1 Junction Ln Unit 1
- 34 Porter Ln
- 893 Highland St
- 300 Willow St Unit 3
- 32 Martel Rd
- 17 Canter Brook Ln Unit 17
- 14 Bradford Rd
- 103 Essex St
- 246 Echo Cove Rd
- 240 Larch Row
- 12 Wallis Dr
- 61 Beech St
Your Personal Tour Guide
Ask me questions while you tour the home.