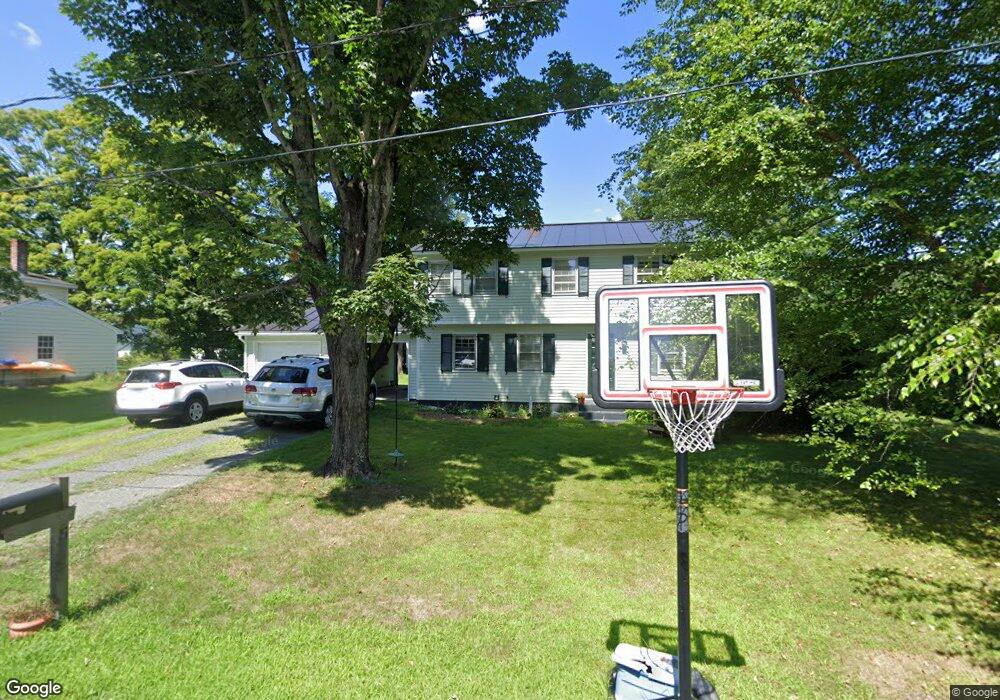
5 Bridgman Rd Hanover, NH 03755
Estimated Value: $852,000 - $1,045,000
4
Beds
3
Baths
1,643
Sq Ft
$562/Sq Ft
Est. Value
About This Home
This home is located at 5 Bridgman Rd, Hanover, NH 03755 and is currently estimated at $922,596, approximately $561 per square foot. 5 Bridgman Rd is a home located in Grafton County with nearby schools including Bernice A. Ray School, Frances C. Richmond School, and Hanover High School.
Ownership History
Date
Name
Owned For
Owner Type
Purchase Details
Closed on
Jun 22, 2018
Sold by
Duscheid Stevenl and Duscheid Anthony Denise
Bought by
Coker Martha L and Figueroa Edy A
Current Estimated Value
Home Financials for this Owner
Home Financials are based on the most recent Mortgage that was taken out on this home.
Original Mortgage
$275,000
Outstanding Balance
$162,431
Interest Rate
4%
Mortgage Type
New Conventional
Estimated Equity
$760,165
Purchase Details
Closed on
Nov 9, 1999
Sold by
Rip Ridge T
Bought by
Duscheid Steven L
Purchase Details
Closed on
Jul 29, 1999
Sold by
Heckman Carey Eugene
Bought by
Rip Ridge T
Create a Home Valuation Report for This Property
The Home Valuation Report is an in-depth analysis detailing your home's value as well as a comparison with similar homes in the area
Home Values in the Area
Average Home Value in this Area
Purchase History
| Date | Buyer | Sale Price | Title Company |
|---|---|---|---|
| Coker Martha L | $575,000 | -- | |
| Duscheid Steven L | $230,000 | -- | |
| Rip Ridge T | $180,000 | -- | |
| Coker Martha L | $575,000 | -- | |
| Duscheid Steven L | $230,000 | -- | |
| Rip Ridge T | $180,000 | -- |
Source: Public Records
Mortgage History
| Date | Status | Borrower | Loan Amount |
|---|---|---|---|
| Open | Rip Ridge T | $275,000 | |
| Closed | Rip Ridge T | $275,000 | |
| Previous Owner | Rip Ridge T | $300,000 |
Source: Public Records
Tax History Compared to Growth
Tax History
| Year | Tax Paid | Tax Assessment Tax Assessment Total Assessment is a certain percentage of the fair market value that is determined by local assessors to be the total taxable value of land and additions on the property. | Land | Improvement |
|---|---|---|---|---|
| 2024 | $11,670 | $605,600 | $255,000 | $350,600 |
| 2023 | $11,228 | $605,600 | $255,000 | $350,600 |
| 2022 | $10,774 | $605,600 | $255,000 | $350,600 |
| 2021 | $10,683 | $605,600 | $255,000 | $350,600 |
| 2020 | $10,519 | $520,500 | $310,000 | $210,500 |
| 2019 | $10,374 | $520,500 | $310,000 | $210,500 |
| 2018 | $10,009 | $520,500 | $310,000 | $210,500 |
| 2017 | $9,756 | $449,800 | $196,400 | $253,400 |
| 2016 | $9,576 | $449,800 | $196,400 | $253,400 |
| 2015 | $9,392 | $449,800 | $196,400 | $253,400 |
| 2014 | $9,009 | $449,800 | $196,400 | $253,400 |
| 2013 | $8,686 | $449,800 | $196,400 | $253,400 |
| 2012 | $7,973 | $431,200 | $170,100 | $261,100 |
Source: Public Records
Map
Nearby Homes