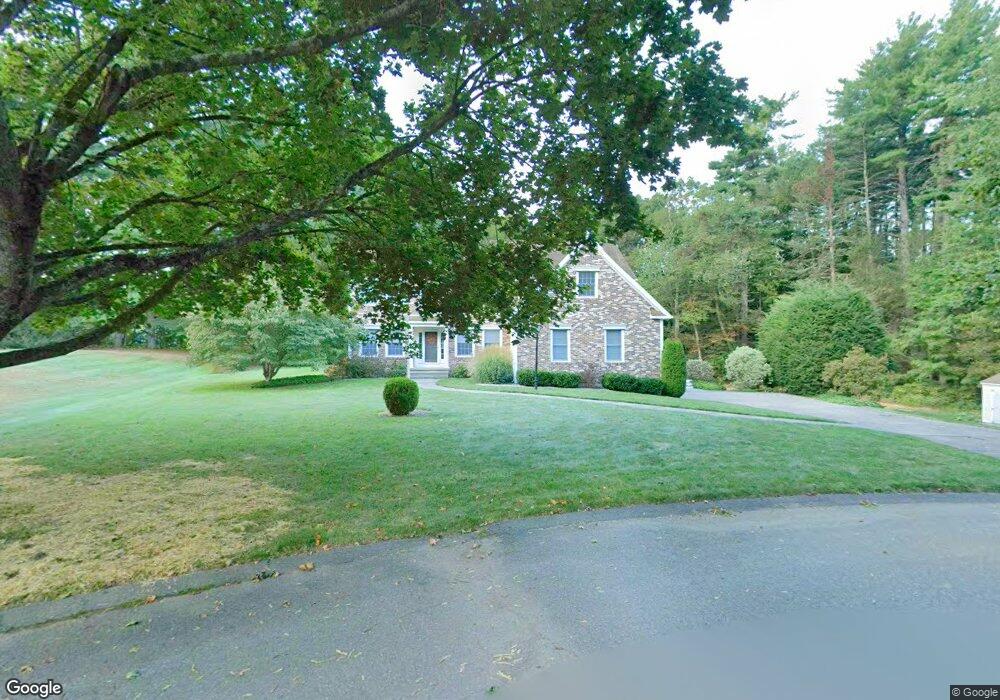
5 Brittany Ln Easthampton, MA 01027
Estimated Value: $562,000 - $792,000
5
Beds
3
Baths
3,306
Sq Ft
$215/Sq Ft
Est. Value
About This Home
This home is located at 5 Brittany Ln, Easthampton, MA 01027 and is currently estimated at $711,107, approximately $215 per square foot. 5 Brittany Ln is a home located in Hampshire County with nearby schools including Easthampton High School, Tri-County Schools, and New England Adolescent Research Institute.
Ownership History
Date
Name
Owned For
Owner Type
Purchase Details
Closed on
Apr 22, 2005
Sold by
Ryan David L and Ryan Susan A
Bought by
Veit Elizabeth A and Veit Steven M
Current Estimated Value
Home Financials for this Owner
Home Financials are based on the most recent Mortgage that was taken out on this home.
Original Mortgage
$225,000
Outstanding Balance
$116,787
Interest Rate
5.87%
Mortgage Type
Purchase Money Mortgage
Estimated Equity
$594,320
Create a Home Valuation Report for This Property
The Home Valuation Report is an in-depth analysis detailing your home's value as well as a comparison with similar homes in the area
Home Values in the Area
Average Home Value in this Area
Purchase History
| Date | Buyer | Sale Price | Title Company |
|---|---|---|---|
| Veit Elizabeth A | $415,000 | -- |
Source: Public Records
Mortgage History
| Date | Status | Borrower | Loan Amount |
|---|---|---|---|
| Open | Veit Elizabeth A | $225,000 | |
| Previous Owner | Veit Elizabeth A | $130,000 |
Source: Public Records
Tax History
| Year | Tax Paid | Tax Assessment Tax Assessment Total Assessment is a certain percentage of the fair market value that is determined by local assessors to be the total taxable value of land and additions on the property. | Land | Improvement |
|---|---|---|---|---|
| 2025 | $9,126 | $667,600 | $133,700 | $533,900 |
| 2024 | $8,845 | $652,300 | $129,800 | $522,500 |
| 2023 | $6,521 | $445,100 | $102,800 | $342,300 |
| 2022 | $7,358 | $445,100 | $102,800 | $342,300 |
| 2021 | $8,137 | $463,900 | $102,800 | $361,100 |
| 2020 | $7,905 | $445,100 | $102,800 | $342,300 |
| 2019 | $7,051 | $456,100 | $102,800 | $353,300 |
| 2018 | $6,757 | $422,300 | $96,800 | $325,500 |
| 2017 | $6,591 | $406,600 | $93,000 | $313,600 |
| 2016 | $6,339 | $406,600 | $93,000 | $313,600 |
| 2015 | -- | $406,600 | $93,000 | $313,600 |
Source: Public Records
Map
Nearby Homes
Your Personal Tour Guide
Ask me questions while you tour the home.