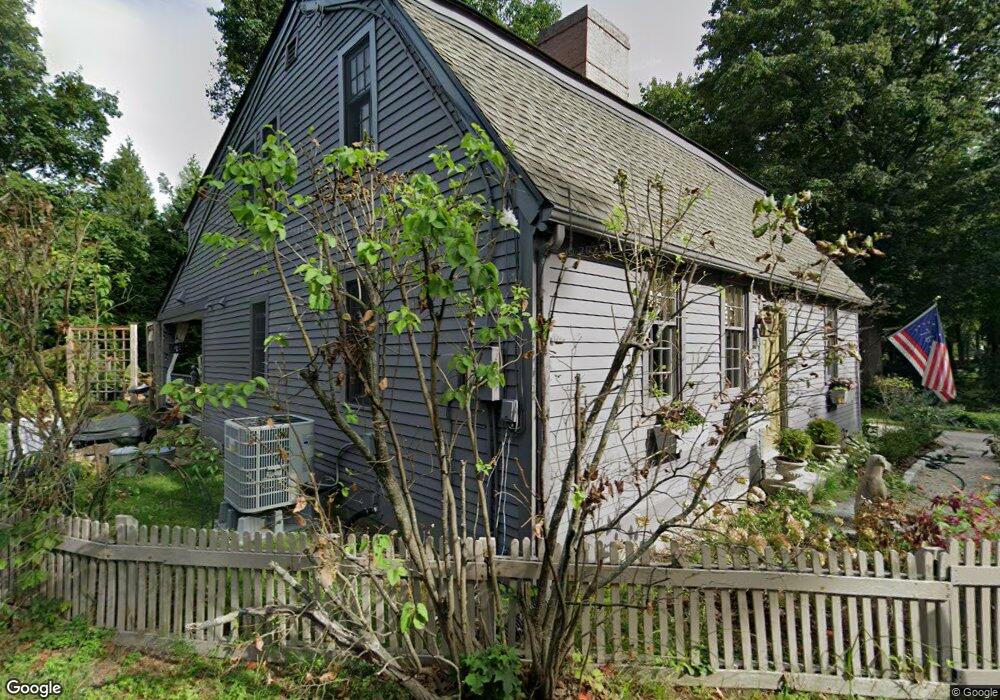
5 Broad St Hollis, NH 03049
Hollis NeighborhoodEstimated Value: $634,000 - $759,000
2
Beds
2
Baths
1,943
Sq Ft
$348/Sq Ft
Est. Value
About This Home
This home is located at 5 Broad St, Hollis, NH 03049 and is currently estimated at $676,372, approximately $348 per square foot. 5 Broad St is a home with nearby schools including Hollis Primary School, Hollis Upper Elementary School, and Hollis-Brookline Middle School.
Ownership History
Date
Name
Owned For
Owner Type
Purchase Details
Closed on
Aug 7, 2025
Sold by
Barbour Theodore M and Barbour Elizabeth F
Bought by
Tbeb Ret and Barbour
Current Estimated Value
Purchase Details
Closed on
Jun 3, 1999
Sold by
Buckley Paula C
Bought by
Barbour Theodore M and Barbour Elizabeth F
Create a Home Valuation Report for This Property
The Home Valuation Report is an in-depth analysis detailing your home's value as well as a comparison with similar homes in the area
Home Values in the Area
Average Home Value in this Area
Purchase History
| Date | Buyer | Sale Price | Title Company |
|---|---|---|---|
| Tbeb Ret | -- | -- | |
| Tbeb Ret | -- | -- | |
| Barbour Theodore M | $235,000 | -- | |
| Barbour Theodore M | $235,000 | -- |
Source: Public Records
Mortgage History
| Date | Status | Borrower | Loan Amount |
|---|---|---|---|
| Previous Owner | Barbour Theodore M | $241,250 | |
| Previous Owner | Barbour Theodore M | $246,500 | |
| Previous Owner | Barbour Theodore M | $255,000 |
Source: Public Records
Tax History
| Year | Tax Paid | Tax Assessment Tax Assessment Total Assessment is a certain percentage of the fair market value that is determined by local assessors to be the total taxable value of land and additions on the property. | Land | Improvement |
|---|---|---|---|---|
| 2024 | $9,179 | $517,700 | $192,900 | $324,800 |
| 2023 | $8,625 | $517,700 | $192,900 | $324,800 |
| 2022 | $11,684 | $517,700 | $192,900 | $324,800 |
| 2021 | $8,317 | $366,400 | $123,800 | $242,600 |
| 2020 | $7,005 | $366,400 | $123,800 | $242,600 |
| 2019 | $8,464 | $366,400 | $123,800 | $242,600 |
| 2018 | $7,794 | $366,400 | $123,800 | $242,600 |
| 2017 | $7,841 | $338,700 | $93,600 | $245,100 |
| 2016 | $7,936 | $338,700 | $93,600 | $245,100 |
| 2015 | $7,797 | $338,700 | $93,600 | $245,100 |
| 2014 | $7,834 | $338,700 | $93,600 | $245,100 |
| 2013 | $8,078 | $354,000 | $93,600 | $260,400 |
Source: Public Records
Map
Nearby Homes
- 77 Broad St
- 39 Apple Ln Unit B
- 95 Wright Rd
- 1 Dalkeith Rd
- 194 Dow Rd
- 9-48-8 Ladd Ln
- 1 Ladd Ln
- 47 S Merrimack Rd Unit Lot 47-44-1
- 199 Pine Hill Rd
- 26 Snow Ln
- 4 Southgate Rd
- 6 Flint Meadow Dr
- 77 Birchwood Dr
- 1 Pats Way
- 23 Mahogany Dr Unit U117
- 3 Mayfair Ln Unit U207
- 3 Mayfair Ln Unit U108
- 8B Louis Dr
- 39 Bartemus Trail Unit U449
- 107 Bartemus Trail Unit U478
Your Personal Tour Guide
Ask me questions while you tour the home.