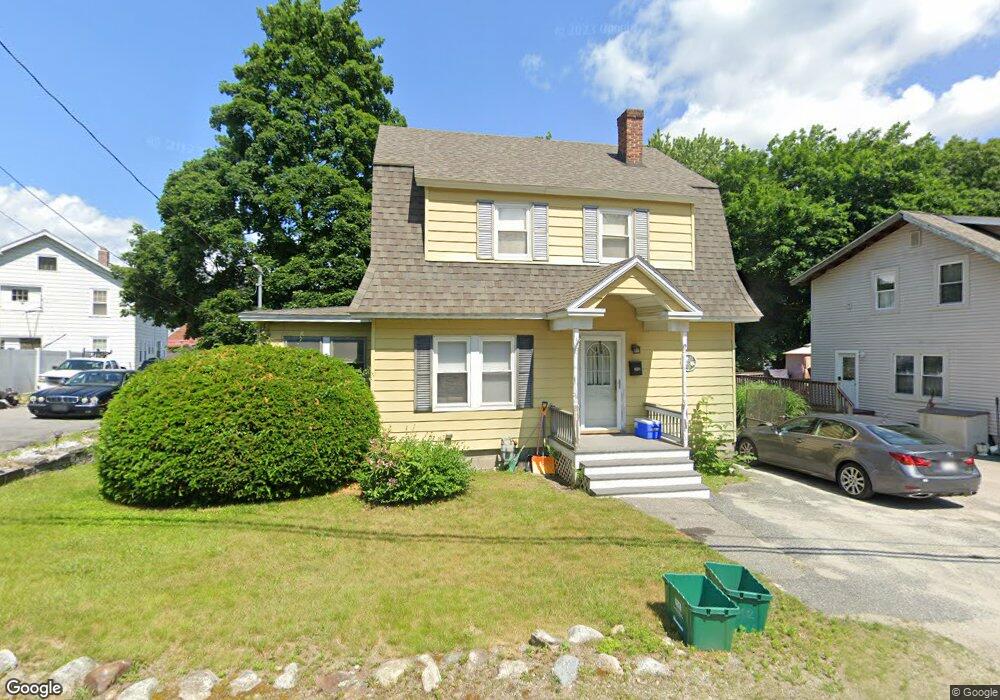
5 Brookside Ave Worcester, MA 01602
West Tatnuck NeighborhoodEstimated Value: $393,242 - $408,000
3
Beds
1
Bath
1,344
Sq Ft
$296/Sq Ft
Est. Value
About This Home
This home is located at 5 Brookside Ave, Worcester, MA 01602 and is currently estimated at $397,811, approximately $295 per square foot. 5 Brookside Ave is a home located in Worcester County with nearby schools including Tatnuck Magnet School, Chandler Magnet, and Jacob Hiatt Magnet School.
Ownership History
Date
Name
Owned For
Owner Type
Purchase Details
Closed on
Jun 6, 2025
Sold by
Pagano Joseph L and Pagano Kathleen O
Bought by
Pagano
Current Estimated Value
Purchase Details
Closed on
Aug 15, 2014
Sold by
Chaban Kathleen A and Daignault Kathleen A
Bought by
Chaban Kathleen A and Chaban Yosef Z
Purchase Details
Closed on
Mar 7, 2006
Sold by
Daignault Maureen D and Daignault Paul L
Bought by
Daignault Kathleen A
Create a Home Valuation Report for This Property
The Home Valuation Report is an in-depth analysis detailing your home's value as well as a comparison with similar homes in the area
Home Values in the Area
Average Home Value in this Area
Purchase History
| Date | Buyer | Sale Price | Title Company |
|---|---|---|---|
| Pagano | -- | None Available | |
| Pagano | -- | None Available | |
| Chaban Kathleen A | -- | -- | |
| Chaban Kathleen A | -- | -- | |
| Daignault Kathleen A | -- | -- | |
| Daignault Kathleen A | -- | -- |
Source: Public Records
Mortgage History
| Date | Status | Borrower | Loan Amount |
|---|---|---|---|
| Previous Owner | Daignault Kathleen A | $125,000 | |
| Previous Owner | Daignault Kathleen A | $23,000 | |
| Previous Owner | Daignault Kathleen A | $12,030 |
Source: Public Records
Tax History
| Year | Tax Paid | Tax Assessment Tax Assessment Total Assessment is a certain percentage of the fair market value that is determined by local assessors to be the total taxable value of land and additions on the property. | Land | Improvement |
|---|---|---|---|---|
| 2025 | $4,043 | $306,500 | $100,900 | $205,600 |
| 2024 | $3,975 | $289,100 | $100,900 | $188,200 |
| 2023 | $3,800 | $265,000 | $87,700 | $177,300 |
| 2022 | $3,483 | $229,000 | $70,200 | $158,800 |
| 2021 | $3,287 | $201,900 | $56,200 | $145,700 |
| 2020 | $3,198 | $188,100 | $56,200 | $131,900 |
| 2019 | $3,073 | $170,700 | $50,500 | $120,200 |
| 2018 | $3,062 | $161,900 | $50,500 | $111,400 |
| 2017 | $2,952 | $153,600 | $50,500 | $103,100 |
| 2016 | $2,898 | $140,600 | $37,700 | $102,900 |
| 2015 | $2,822 | $140,600 | $37,700 | $102,900 |
| 2014 | $2,747 | $140,600 | $37,700 | $102,900 |
Source: Public Records
Map
Nearby Homes
- 23 Tiverton Pkwy
- 12 Cardinal Rd
- 9 Newburn Rd
- 118 Beaconsfield Rd
- 8 Modred Ct
- 47R Yarnie Unit 3A
- 47R Yarnie Unit 1B
- 47R Yarnie Unit 2B
- 47R Yarnie Unit 4B
- 47R Yarnie Unit 8B
- 47R Yarnie Unit 5A
- 47R Yarnie Unit 6B
- 47R Yarnie Unit 4A
- 47R Yarnie Unit 1A
- 47R Yarnie Unit 9
- 47R Yarnie Unit 8A
- 47R Yarnie Unit 6A
- 47R Yarnie Unit 7A
- 47R Yarnie Unit 5B
- 47R Yarnie Unit 2A
Your Personal Tour Guide
Ask me questions while you tour the home.