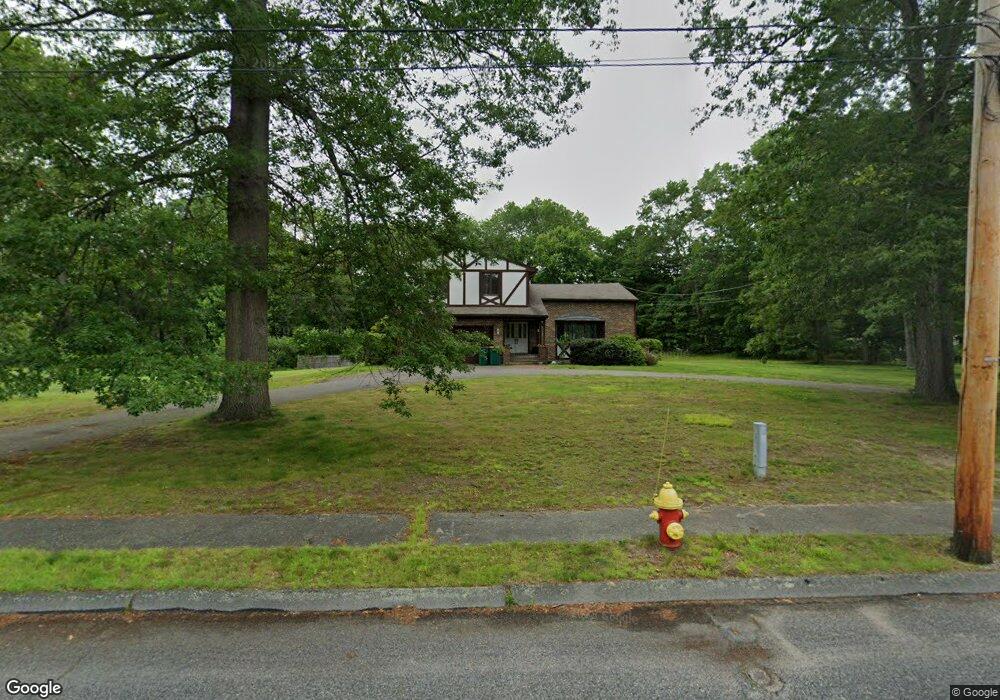
5 Brookside Rd Mansfield, MA 02048
Estimated Value: $811,656 - $1,123,000
4
Beds
3
Baths
2,836
Sq Ft
$316/Sq Ft
Est. Value
About This Home
This home is located at 5 Brookside Rd, Mansfield, MA 02048 and is currently estimated at $895,914, approximately $315 per square foot. 5 Brookside Rd is a home located in Bristol County with nearby schools including Everett W. Robinson Elementary School, Jordan/Jackson Elementary School, and Harold L. Qualters Middle School.
Ownership History
Date
Name
Owned For
Owner Type
Purchase Details
Closed on
Jul 20, 2000
Sold by
Kourafas Kenneth S and Kourafas Kathryn M
Bought by
Masison Richard C and Masison Twila Y
Current Estimated Value
Purchase Details
Closed on
Mar 1, 1995
Sold by
Willis Gary K and Willis Gary Keith
Bought by
Kourafas Kenneth S
Create a Home Valuation Report for This Property
The Home Valuation Report is an in-depth analysis detailing your home's value as well as a comparison with similar homes in the area
Home Values in the Area
Average Home Value in this Area
Purchase History
| Date | Buyer | Sale Price | Title Company |
|---|---|---|---|
| Masison Richard C | $309,900 | -- | |
| Kourafas Kenneth S | $202,000 | -- |
Source: Public Records
Mortgage History
| Date | Status | Borrower | Loan Amount |
|---|---|---|---|
| Open | Kourafas Kenneth S | $220,000 | |
| Closed | Kourafas Kenneth S | $250,000 | |
| Closed | Kourafas Kenneth S | $250,000 |
Source: Public Records
Tax History
| Year | Tax Paid | Tax Assessment Tax Assessment Total Assessment is a certain percentage of the fair market value that is determined by local assessors to be the total taxable value of land and additions on the property. | Land | Improvement |
|---|---|---|---|---|
| 2025 | $8,931 | $678,100 | $281,100 | $397,000 |
| 2024 | $8,988 | $665,800 | $268,400 | $397,400 |
| 2023 | $8,705 | $617,800 | $268,400 | $349,400 |
| 2022 | $8,374 | $552,000 | $248,700 | $303,300 |
| 2021 | $3,681 | $548,400 | $236,500 | $311,900 |
| 2020 | $3,142 | $498,900 | $207,200 | $291,700 |
| 2019 | $7,634 | $501,600 | $197,300 | $304,300 |
| 2018 | $3,970 | $470,000 | $188,400 | $281,600 |
| 2017 | $3,882 | $464,800 | $183,200 | $281,600 |
| 2016 | $6,985 | $453,300 | $174,300 | $279,000 |
| 2015 | $6,439 | $415,400 | $174,300 | $241,100 |
Source: Public Records
Map
Nearby Homes
- 14 Claire Ave
- 2 Oak St Unit 2B
- 150 Gilbert St
- 451R Gilbert St
- 128 Tremont St
- 250 Mansfield Ave Unit 11
- 71 Richardson Ave
- 343 Godfrey Dr
- 24 Maverick Dr
- 143 Oak St Unit 10
- 49 Pheasant Hill Rd
- 1769 West St
- 157 Mansfield Ave Unit 27
- 157 Mansfield Ave Unit 14
- 10 Walter St
- 19 Barberry Rd
- 16 Holly Rd
- 345 Richardson Ave
- 44 Fairfield Park Unit 44
- 17 Childs Ln
Your Personal Tour Guide
Ask me questions while you tour the home.