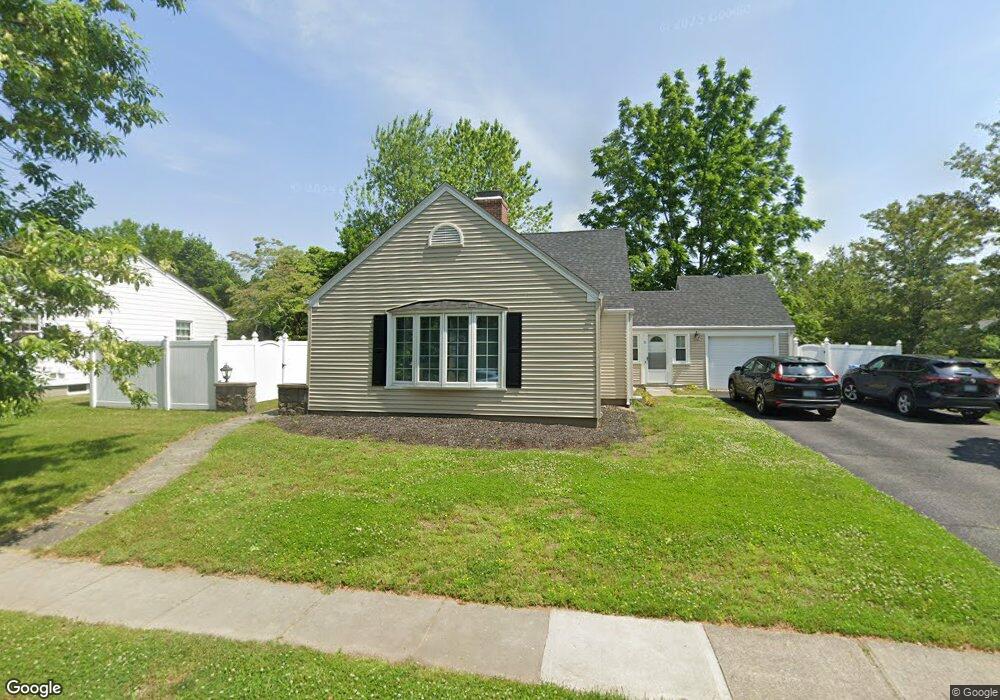
5 Bryant Rd Cranston, RI 02910
Eden Park NeighborhoodEstimated Value: $516,115 - $550,000
4
Beds
2
Baths
2,212
Sq Ft
$244/Sq Ft
Est. Value
About This Home
This home is located at 5 Bryant Rd, Cranston, RI 02910 and is currently estimated at $540,529, approximately $244 per square foot. 5 Bryant Rd is a home located in Providence County with nearby schools including Park View Middle School, Cranston High School East, and Cadence Academy Preschool - Cranston.
Ownership History
Date
Name
Owned For
Owner Type
Purchase Details
Closed on
Jul 27, 2023
Sold by
Graziano Joseph R and Diserio Amanda K
Bought by
Graziano Amanda
Current Estimated Value
Purchase Details
Closed on
Feb 1, 2010
Sold by
Calvary Covenant Chrch
Bought by
Diserio Amanda K and Graziano Joseph R
Home Financials for this Owner
Home Financials are based on the most recent Mortgage that was taken out on this home.
Original Mortgage
$185,000
Interest Rate
4.95%
Mortgage Type
Purchase Money Mortgage
Create a Home Valuation Report for This Property
The Home Valuation Report is an in-depth analysis detailing your home's value as well as a comparison with similar homes in the area
Home Values in the Area
Average Home Value in this Area
Purchase History
| Date | Buyer | Sale Price | Title Company |
|---|---|---|---|
| Graziano Amanda | -- | None Available | |
| Diserio Amanda K | $225,000 | -- |
Source: Public Records
Mortgage History
| Date | Status | Borrower | Loan Amount |
|---|---|---|---|
| Previous Owner | Diserio Amanda K | $185,000 |
Source: Public Records
Tax History
| Year | Tax Paid | Tax Assessment Tax Assessment Total Assessment is a certain percentage of the fair market value that is determined by local assessors to be the total taxable value of land and additions on the property. | Land | Improvement |
|---|---|---|---|---|
| 2025 | $6,225 | $448,500 | $99,900 | $348,600 |
| 2024 | $6,104 | $448,500 | $99,900 | $348,600 |
| 2023 | $5,715 | $302,400 | $65,800 | $236,600 |
| 2022 | $5,597 | $302,400 | $65,800 | $236,600 |
| 2021 | $5,443 | $302,400 | $65,800 | $236,600 |
| 2020 | $4,885 | $235,200 | $62,700 | $172,500 |
| 2019 | $4,885 | $235,200 | $62,700 | $172,500 |
| 2018 | $4,772 | $235,200 | $62,700 | $172,500 |
| 2017 | $4,409 | $192,200 | $56,400 | $135,800 |
| 2016 | $4,315 | $192,200 | $56,400 | $135,800 |
| 2015 | $4,315 | $192,200 | $56,400 | $135,800 |
| 2014 | $4,413 | $193,200 | $56,400 | $136,800 |
Source: Public Records
Map
Nearby Homes
Your Personal Tour Guide
Ask me questions while you tour the home.