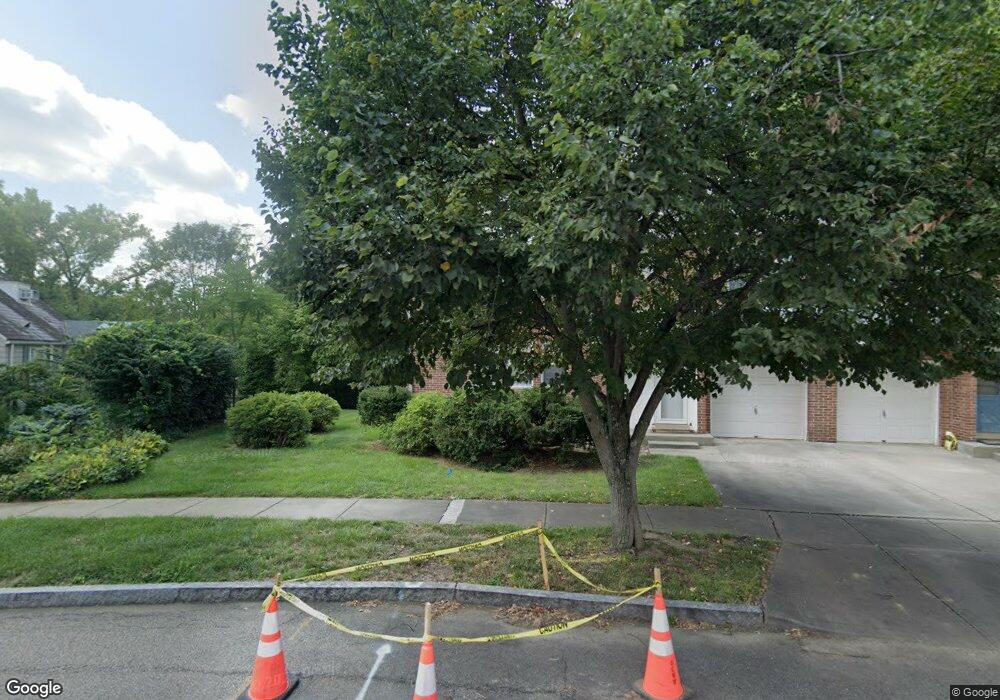
5 Burnham St Cincinnati, OH 45218
Estimated Value: $185,000 - $198,650
3
Beds
2
Baths
1,584
Sq Ft
$120/Sq Ft
Est. Value
About This Home
This home is located at 5 Burnham St, Cincinnati, OH 45218 and is currently estimated at $189,913, approximately $119 per square foot. 5 Burnham St is a home located in Hamilton County with nearby schools including Central Montessori Academy and John Paul II Catholic School.
Ownership History
Date
Name
Owned For
Owner Type
Purchase Details
Closed on
Sep 16, 2021
Sold by
Stull Bruce Alan and Stull Mary Jo
Bought by
Stull Kirk Bryan
Current Estimated Value
Purchase Details
Closed on
Sep 15, 2021
Sold by
Stull Clark Edmon and Jencault Jeanette
Bought by
Stull Kirk Bryan
Purchase Details
Closed on
Oct 4, 2003
Sold by
Stull Leslie R and Stull Verda B
Bought by
Stull Brett J
Create a Home Valuation Report for This Property
The Home Valuation Report is an in-depth analysis detailing your home's value as well as a comparison with similar homes in the area
Home Values in the Area
Average Home Value in this Area
Purchase History
| Date | Buyer | Sale Price | Title Company |
|---|---|---|---|
| Stull Kirk Bryan | -- | None Available | |
| Stull Bruce Alan | -- | None Available | |
| Stull Kirk Bryan | -- | None Available | |
| Stull Brett J | $50,000 | -- |
Source: Public Records
Tax History Compared to Growth
Tax History
| Year | Tax Paid | Tax Assessment Tax Assessment Total Assessment is a certain percentage of the fair market value that is determined by local assessors to be the total taxable value of land and additions on the property. | Land | Improvement |
|---|---|---|---|---|
| 2024 | $2,949 | $44,034 | $10,371 | $33,663 |
| 2023 | $2,745 | $44,034 | $10,371 | $33,663 |
| 2022 | $2,497 | $29,877 | $8,670 | $21,207 |
| 2021 | $2,446 | $29,877 | $8,670 | $21,207 |
| 2020 | $2,481 | $29,877 | $8,670 | $21,207 |
| 2019 | $2,413 | $25,537 | $7,410 | $18,127 |
| 2018 | $2,418 | $25,537 | $7,410 | $18,127 |
| 2017 | $2,242 | $25,537 | $7,410 | $18,127 |
| 2016 | $2,665 | $29,740 | $8,211 | $21,529 |
| 2015 | $2,504 | $29,740 | $8,211 | $21,529 |
| 2014 | $2,562 | $29,740 | $8,211 | $21,529 |
| 2013 | $2,569 | $30,661 | $8,467 | $22,194 |
Source: Public Records
Map
Nearby Homes