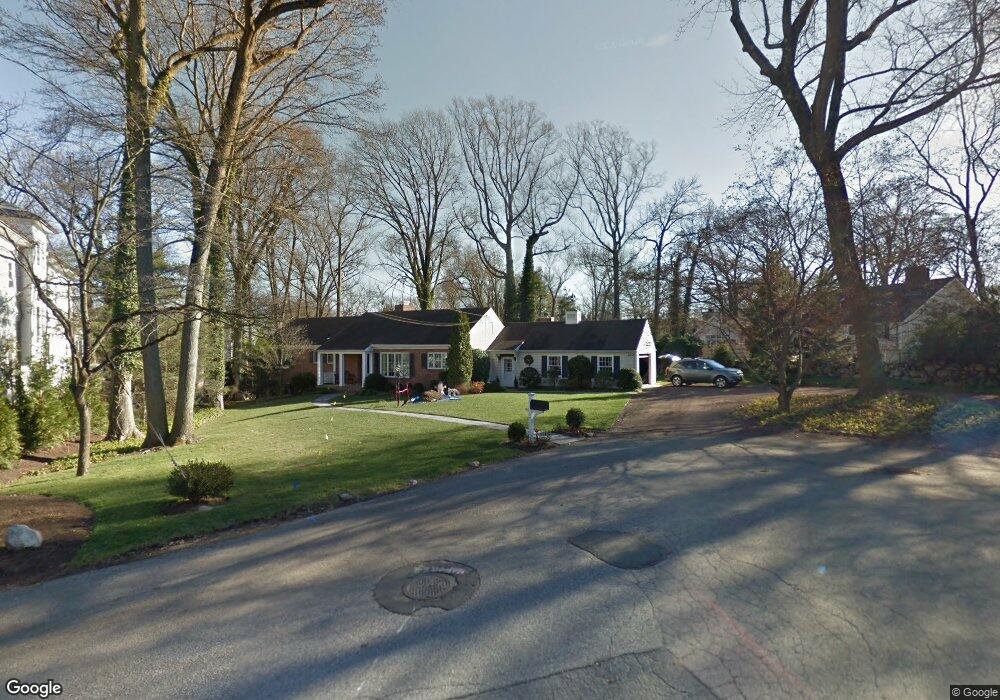
5 Campbell Ct Riverside, CT 06878
Estimated Value: $2,205,000 - $4,186,000
4
Beds
4
Baths
3,545
Sq Ft
$1,004/Sq Ft
Est. Value
About This Home
This home is located at 5 Campbell Ct, Riverside, CT 06878 and is currently estimated at $3,558,589, approximately $1,003 per square foot. 5 Campbell Ct is a home located in Fairfield County with nearby schools including Riverside School, Eastern Middle School, and Greenwich High School.
Ownership History
Date
Name
Owned For
Owner Type
Purchase Details
Closed on
May 30, 2024
Sold by
Rogers Mark T and Rogers Allison W
Bought by
Mark T Rogers Ret and Rogers
Current Estimated Value
Purchase Details
Closed on
Jul 15, 1998
Sold by
Bissett Nancy C
Bought by
Rogers Mark T and Rogers Allison W
Home Financials for this Owner
Home Financials are based on the most recent Mortgage that was taken out on this home.
Original Mortgage
$425,000
Interest Rate
6.98%
Mortgage Type
Unknown
Create a Home Valuation Report for This Property
The Home Valuation Report is an in-depth analysis detailing your home's value as well as a comparison with similar homes in the area
Home Values in the Area
Average Home Value in this Area
Purchase History
| Date | Buyer | Sale Price | Title Company |
|---|---|---|---|
| Mark T Rogers Ret | -- | None Available | |
| Rogers Mark T | $733,000 | -- | |
| Rogers Mark T | $733,000 | -- |
Source: Public Records
Mortgage History
| Date | Status | Borrower | Loan Amount |
|---|---|---|---|
| Previous Owner | Rogers Mark T | $425,000 | |
| Previous Owner | Rogers Mark T | $190,000 |
Source: Public Records
Tax History
| Year | Tax Paid | Tax Assessment Tax Assessment Total Assessment is a certain percentage of the fair market value that is determined by local assessors to be the total taxable value of land and additions on the property. | Land | Improvement |
|---|---|---|---|---|
| 2025 | $19,651 | $1,589,980 | $1,267,700 | $322,280 |
| 2024 | $18,978 | $1,589,980 | $1,267,700 | $322,280 |
| 2023 | $18,501 | $1,589,980 | $1,267,700 | $322,280 |
| 2022 | $18,332 | $1,589,980 | $1,267,700 | $322,280 |
| 2021 | $17,992 | $1,494,360 | $1,160,180 | $334,180 |
| 2020 | $17,962 | $1,494,360 | $1,160,180 | $334,180 |
| 2019 | $18,062 | $1,487,850 | $1,160,110 | $327,740 |
| 2018 | $17,661 | $1,487,850 | $1,160,110 | $327,740 |
| 2017 | $17,882 | $1,487,850 | $1,160,110 | $327,740 |
| 2016 | $17,600 | $1,487,850 | $1,160,110 | $327,740 |
| 2015 | $17,096 | $1,433,600 | $1,282,680 | $150,920 |
| 2014 | $16,666 | $1,433,600 | $1,282,680 | $150,920 |
Source: Public Records
Map
Nearby Homes
- 11 Field Rd
- 227 Riverside Ave
- 25 Summit Rd
- 5 Greenwich Cove Dr
- 177 Indian Head Rd
- 37 Miltiades Ave
- 63 Wesskum Wood Rd
- 25 West Way
- 8 Park Ave
- 48 Meyer Place
- 6 Clark St
- 10 Verona Dr
- 15 River Rd Unit 210
- 7 River Rd Unit Boat Slip A-2
- 7 River Rd Unit Boat Slip E3
- 7 River Rd Unit Boat Slip H3
- 25 Dialstone Ln
- 2 Forest Ave
- 29 Sound Beach Ave
- 4 Miami Ct
Your Personal Tour Guide
Ask me questions while you tour the home.