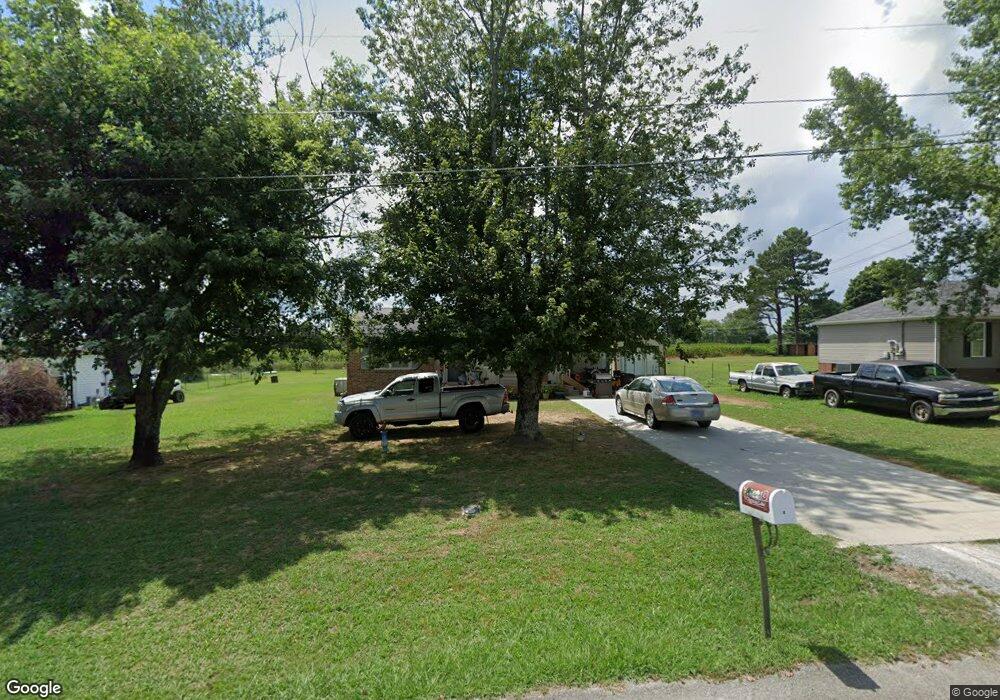
5 Chapman Ln Fayetteville, TN 37334
Estimated Value: $149,000 - $188,000
2
Beds
1
Bath
1,019
Sq Ft
$164/Sq Ft
Est. Value
About This Home
This home is located at 5 Chapman Ln, Fayetteville, TN 37334 and is currently estimated at $167,507, approximately $164 per square foot. 5 Chapman Ln is a home located in Lincoln County with nearby schools including Highland Rim School, Lincoln Central Academy, and Lincoln County High School.
Ownership History
Date
Name
Owned For
Owner Type
Purchase Details
Closed on
Jul 21, 2020
Sold by
Lawrence Joseph B and Lawrence Betty L
Bought by
Anderson Andrew Scott and Anderson Jessica Smith
Current Estimated Value
Home Financials for this Owner
Home Financials are based on the most recent Mortgage that was taken out on this home.
Original Mortgage
$66,950
Outstanding Balance
$35,030
Interest Rate
3.2%
Mortgage Type
Future Advance Clause Open End Mortgage
Estimated Equity
$132,477
Purchase Details
Closed on
May 19, 2011
Sold by
King Herbert L
Bought by
Lawrence Joseph B and Lawrence Betty L
Purchase Details
Closed on
Nov 2, 2006
Sold by
Ray Ivey Donnie
Bought by
Herbert King and Herbert Debra
Purchase Details
Closed on
May 10, 1994
Bought by
Ivey Mattie Kate
Purchase Details
Closed on
Jun 27, 1990
Bought by
Childress Terry
Purchase Details
Closed on
Sep 18, 1979
Bought by
Ivey Mattie
Create a Home Valuation Report for This Property
The Home Valuation Report is an in-depth analysis detailing your home's value as well as a comparison with similar homes in the area
Home Values in the Area
Average Home Value in this Area
Purchase History
| Date | Buyer | Sale Price | Title Company |
|---|---|---|---|
| Anderson Andrew Scott | $70,500 | None Available | |
| Anderson Andrew Scott | $70,500 | None Available | |
| Lawrence Joseph B | $45,000 | -- | |
| Lawrence Joseph B | $45,000 | -- | |
| Herbert King | $65,000 | -- | |
| Ivey Mattie Kate | $40,000 | -- | |
| Ivey Mattie Kate | $40,000 | -- | |
| Childress Terry | -- | -- | |
| Childress Terry | -- | -- | |
| Ivey Mattie | -- | -- | |
| Ivey Mattie | -- | -- |
Source: Public Records
Mortgage History
| Date | Status | Borrower | Loan Amount |
|---|---|---|---|
| Open | Anderson Andrew Scott | $66,950 | |
| Closed | Anderson Andrew Scott | $66,950 |
Source: Public Records
Tax History Compared to Growth
Tax History
| Year | Tax Paid | Tax Assessment Tax Assessment Total Assessment is a certain percentage of the fair market value that is determined by local assessors to be the total taxable value of land and additions on the property. | Land | Improvement |
|---|---|---|---|---|
| 2024 | $669 | $35,200 | $5,850 | $29,350 |
| 2023 | $501 | $17,375 | $2,625 | $14,750 |
| 2022 | $365 | $17,375 | $2,625 | $14,750 |
| 2021 | $365 | $17,375 | $2,625 | $14,750 |
| 2020 | $365 | $17,375 | $2,625 | $14,750 |
| 2019 | $365 | $17,375 | $2,625 | $14,750 |
| 2018 | $352 | $14,200 | $2,625 | $11,575 |
| 2017 | $332 | $14,200 | $2,625 | $11,575 |
| 2016 | $332 | $14,200 | $2,625 | $11,575 |
| 2015 | -- | $14,200 | $2,625 | $11,575 |
| 2014 | $278 | $14,200 | $2,625 | $11,575 |
Source: Public Records
Map
Nearby Homes
- 3 Chapman Ln
- 19 Lacy Rd
- 43 Plada Heights Rd
- 72 Childress Rd
- 113 Old Huntsville Rd
- 117 Simmons Cir
- 2952 Huntsville Hwy
- 97 Mcalister Rd
- 63 Old Huntsville Rd
- 21 Prospect Rd
- 86 Simmons Cir
- 179 Patrick Rd
- 23 Hodge Ln
- 18 Saddletree Dr
- 52 Ridgeline Dr
- 195 Patrick Rd
- 15 Owens Dr
- 35 Ridgeline Dr
- 69 E Prospect Rd
- 112 Chadwick Farms Dr
- 7 Chapman Ln
- 9 Chapman Ln
- 56 Highland Rim Rd
- 58 Highland Rim Rd
- 6 Chapman Ln
- 4 Chapman Ln
- 8 Chapman Ln
- 10 Chapman Ln
- 52 Highland Rim Rd
- 57 Highland Rim Rd
- 48 Highland Rim Rd
- 35 Long Meadow Dr
- 36 Long Meadow Dr
- 47 Highland Rim Rd
- 67 Highland Rim Rd
- 33 Long Meadow Dr
- 34 Long Meadow Dr
- 72 Highland Rim Rd
- 45 Highland Rim Rd
- 45 Highland Rim Rd