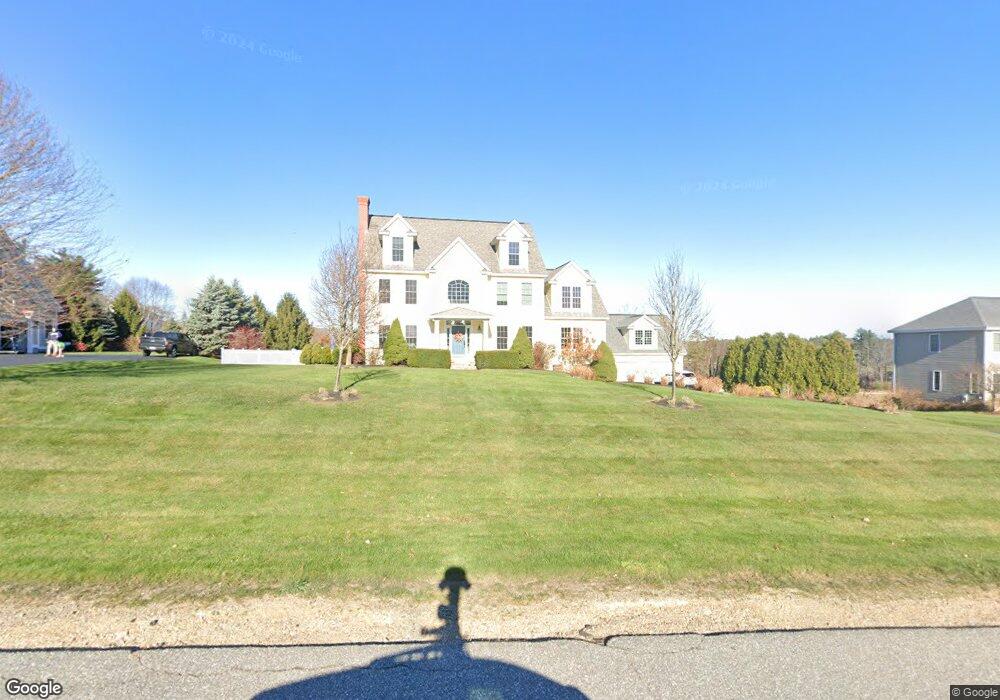
5 Charles Dr Stratham, NH 03885
Estimated Value: $1,241,000 - $1,351,000
4
Beds
4
Baths
3,617
Sq Ft
$361/Sq Ft
Est. Value
About This Home
This home is located at 5 Charles Dr, Stratham, NH 03885 and is currently estimated at $1,306,725, approximately $361 per square foot. 5 Charles Dr is a home located in Rockingham County with nearby schools including Stratham Memorial School, Cooperative Middle School, and Exeter High School.
Ownership History
Date
Name
Owned For
Owner Type
Purchase Details
Closed on
Apr 19, 2019
Sold by
Marlow G Rahn Ret and Rahn
Bought by
Rahn Patrick J and Rahn Marlow G
Current Estimated Value
Home Financials for this Owner
Home Financials are based on the most recent Mortgage that was taken out on this home.
Original Mortgage
$462,500
Outstanding Balance
$404,107
Interest Rate
4.2%
Mortgage Type
New Conventional
Estimated Equity
$902,618
Purchase Details
Closed on
Sep 2, 2016
Sold by
Rahn Patrick J and Rahn Marlow G
Bought by
Marlow G Rahn Ret and Rahn
Home Financials for this Owner
Home Financials are based on the most recent Mortgage that was taken out on this home.
Original Mortgage
$363,000
Interest Rate
3.45%
Mortgage Type
New Conventional
Purchase Details
Closed on
Feb 25, 2016
Sold by
Blanchard Marlow G
Bought by
Marlow G Blanchard Ret and Blanchard
Create a Home Valuation Report for This Property
The Home Valuation Report is an in-depth analysis detailing your home's value as well as a comparison with similar homes in the area
Home Values in the Area
Average Home Value in this Area
Purchase History
| Date | Buyer | Sale Price | Title Company |
|---|---|---|---|
| Rahn Patrick J | -- | -- | |
| Rahn Patrick J | -- | -- | |
| Marlow G Rahn Ret | -- | -- | |
| Rahn Patrick J | -- | -- | |
| Marlow G Blanchard Ret | -- | -- |
Source: Public Records
Mortgage History
| Date | Status | Borrower | Loan Amount |
|---|---|---|---|
| Open | Rahn Patrick J | $462,500 | |
| Closed | Rahn Patrick J | $462,500 | |
| Previous Owner | Rahn Patrick J | $363,000 |
Source: Public Records
Tax History Compared to Growth
Tax History
| Year | Tax Paid | Tax Assessment Tax Assessment Total Assessment is a certain percentage of the fair market value that is determined by local assessors to be the total taxable value of land and additions on the property. | Land | Improvement |
|---|---|---|---|---|
| 2024 | $15,256 | $1,162,800 | $464,200 | $698,600 |
| 2023 | $14,942 | $714,600 | $239,100 | $475,500 |
| 2022 | $13,370 | $714,600 | $239,100 | $475,500 |
| 2021 | $13,201 | $712,800 | $239,100 | $473,700 |
| 2020 | $13,428 | $708,600 | $239,100 | $469,500 |
| 2019 | $13,026 | $699,200 | $239,100 | $460,100 |
| 2018 | $12,092 | $575,800 | $160,900 | $414,900 |
| 2017 | $5,461 | $575,800 | $160,900 | $414,900 |
| 2016 | $11,746 | $575,800 | $160,900 | $414,900 |
| 2015 | $11,166 | $561,100 | $160,900 | $400,200 |
| 2014 | $11,172 | $561,100 | $160,900 | $400,200 |
| 2013 | $10,664 | $542,700 | $160,900 | $381,800 |
Source: Public Records
Map
Nearby Homes
- 177 Winnicutt Rd
- 36 Winnicut Rd Unit 2
- 8 Winterberry Ln
- 91 Lovering Rd
- Homesite 4 Windsong Place
- Homesite 1 Windsong Place
- 638 Post Rd
- 18 Treat Farm Rd
- 14 Balmoral Dr
- 44 High St
- 133R Stratham Heights Rd
- 92 Ridgecrest Dr
- 96 North Rd
- 16 Parkman Brook Ln
- 00 Scamman Rd
- 1 Cherry Rd
- 00 Lovell Rd Unit 22
- 50 Thornhill Rd
- Unit 26 Summerwind Place Unit 26
- 12 Founders Square Unit A
- 3 Charles Dr
- Lot 10 Charles Dr
- 7 Charles Dr
- 1 Charles Dr
- 4 Charles Dr
- 181 Winnicutt Rd
- 2 Charles Dr
- 188R Winnicutt Rd
- 178 Winnicutt Rd
- 178 Winnicutt Rd Unit 2
- 180 Winnicutt Rd
- 1 Niblick Ln
- 190 Winnicutt Rd
- 32 Charles Dr
- 28 Charles Dr
- 22 Charles Dr
- 16 Charles Dr
- 12 Charles Dr
- 20 Charles Dr
- 6 Charles Dr