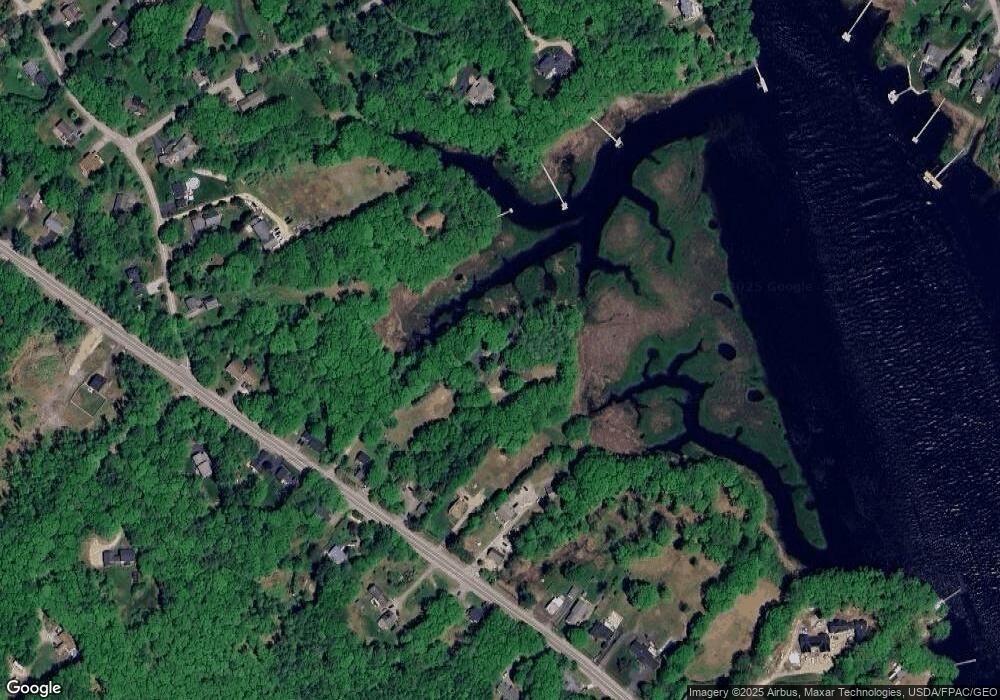
5 Christophers Wharf Ln Biddeford, ME 04005
South Biddeford NeighborhoodEstimated Value: $1,003,000 - $1,429,000
5
Beds
5
Baths
4,200
Sq Ft
$283/Sq Ft
Est. Value
About This Home
This home is located at 5 Christophers Wharf Ln, Biddeford, ME 04005 and is currently estimated at $1,188,383, approximately $282 per square foot. 5 Christophers Wharf Ln is a home located in York County with nearby schools including John F Kennedy Memorial School, Biddeford Primary School, and Biddeford Intermediate School.
Ownership History
Date
Name
Owned For
Owner Type
Purchase Details
Closed on
Dec 3, 2013
Sold by
Mcdonald Gordon L and Mcdonald Joan M
Bought by
Mchugh Brian S
Current Estimated Value
Home Financials for this Owner
Home Financials are based on the most recent Mortgage that was taken out on this home.
Original Mortgage
$352,000
Outstanding Balance
$91,957
Interest Rate
3.36%
Mortgage Type
New Conventional
Estimated Equity
$1,096,426
Create a Home Valuation Report for This Property
The Home Valuation Report is an in-depth analysis detailing your home's value as well as a comparison with similar homes in the area
Home Values in the Area
Average Home Value in this Area
Purchase History
| Date | Buyer | Sale Price | Title Company |
|---|---|---|---|
| Mchugh Brian S | -- | -- |
Source: Public Records
Mortgage History
| Date | Status | Borrower | Loan Amount |
|---|---|---|---|
| Open | Mchugh Brian S | $352,000 |
Source: Public Records
Tax History Compared to Growth
Tax History
| Year | Tax Paid | Tax Assessment Tax Assessment Total Assessment is a certain percentage of the fair market value that is determined by local assessors to be the total taxable value of land and additions on the property. | Land | Improvement |
|---|---|---|---|---|
| 2024 | $10,129 | $712,300 | $298,200 | $414,100 |
| 2023 | $9,302 | $709,000 | $294,900 | $414,100 |
| 2022 | $9,880 | $602,100 | $163,200 | $438,900 |
| 2021 | $9,321 | $511,300 | $141,600 | $369,700 |
| 2020 | $9,331 | $465,400 | $126,400 | $339,000 |
| 2019 | $9,299 | $465,400 | $126,400 | $339,000 |
| 2018 | $9,168 | $465,400 | $126,400 | $339,000 |
| 2017 | $9,108 | $453,800 | $126,400 | $327,400 |
| 2016 | $9,012 | $453,800 | $126,400 | $327,400 |
| 2015 | $8,835 | $453,800 | $126,400 | $327,400 |
| 2014 | $8,618 | $453,800 | $126,400 | $327,400 |
| 2013 | -- | $696,900 | $277,600 | $419,300 |
Source: Public Records
Map
Nearby Homes