Estimated Value: $404,000 - $427,092
3
Beds
2
Baths
2,220
Sq Ft
$186/Sq Ft
Est. Value
About This Home
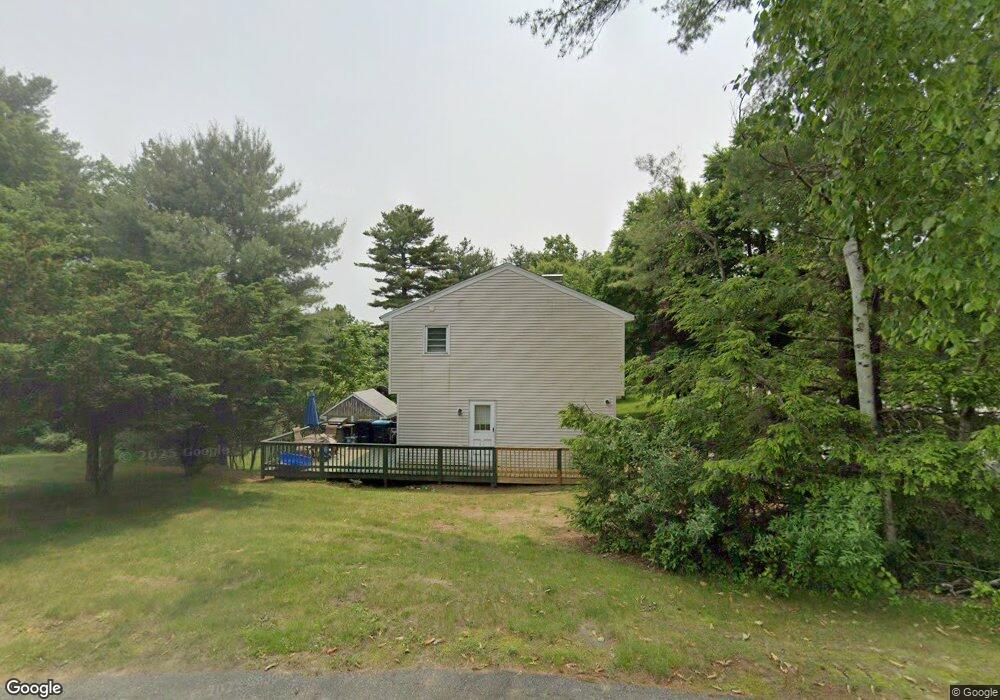
This home is located at 5 Clyde Rd, Derry, NH 03038 and is currently estimated at $414,023, approximately $186 per square foot. 5 Clyde Rd is a home located in Rockingham County with nearby schools including South Range Elementary School, West Running Brook Middle School, and Pinkerton Academy.
Ownership History
Date
Name
Owned For
Owner Type
Purchase Details
Closed on
Nov 30, 2021
Sold by
Lavalley Kathy A
Bought by
Kislowski Mark and Kisklowski Florence
Current Estimated Value
Purchase Details
Closed on
Oct 1, 2007
Sold by
Bengtson Thomas R and Bengtson Susan J
Bought by
Winiarz Kathy A
Home Financials for this Owner
Home Financials are based on the most recent Mortgage that was taken out on this home.
Original Mortgage
$222,000
Interest Rate
6.65%
Purchase Details
Closed on
Aug 25, 2000
Sold by
Christen Mark K and Christen Elaine P
Bought by
Allen Susan J
Home Financials for this Owner
Home Financials are based on the most recent Mortgage that was taken out on this home.
Original Mortgage
$143,500
Interest Rate
8.06%
Create a Home Valuation Report for This Property
The Home Valuation Report is an in-depth analysis detailing your home's value as well as a comparison with similar homes in the area
Home Values in the Area
Average Home Value in this Area
Purchase History
| Date | Buyer | Sale Price | Title Company |
|---|---|---|---|
| Kislowski Mark | $300,000 | None Available | |
| Winiarz Kathy A | $222,000 | -- | |
| Allen Susan J | $155,000 | -- |
Source: Public Records
Mortgage History
| Date | Status | Borrower | Loan Amount |
|---|---|---|---|
| Previous Owner | Allen Susan J | $222,000 | |
| Previous Owner | Allen Susan J | $143,500 |
Source: Public Records
Tax History
| Year | Tax Paid | Tax Assessment Tax Assessment Total Assessment is a certain percentage of the fair market value that is determined by local assessors to be the total taxable value of land and additions on the property. | Land | Improvement |
|---|---|---|---|---|
| 2024 | $6,872 | $367,700 | $0 | $367,700 |
| 2023 | $6,855 | $331,500 | $0 | $331,500 |
| 2022 | $6,312 | $331,500 | $0 | $331,500 |
| 2021 | $6,173 | $249,300 | $0 | $249,300 |
| 2020 | $6,068 | $249,300 | $0 | $249,300 |
| 2019 | $6,590 | $252,300 | $86,000 | $166,300 |
| 2018 | $6,625 | $252,300 | $86,000 | $166,300 |
| 2017 | $6,093 | $225,000 | $86,000 | $139,000 |
| 2016 | $5,964 | $220,400 | $86,000 | $134,400 |
| 2015 | $5,706 | $195,200 | $86,000 | $109,200 |
| 2014 | $5,743 | $195,200 | $86,000 | $109,200 |
| 2013 | $5,860 | $186,100 | $86,000 | $100,100 |
Source: Public Records
Map
Nearby Homes
- 13 Kilrea Rd Unit L
- 5 Craven Terrace
- 242 Rockingham Rd
- 7 Lilac Ridge Rd
- 106 N Lowell Rd
- 139 Rockingham Rd Unit 21
- 71 Island Pond Rd
- 39 Overton Rd
- 8 Blueberry Rd Unit U: R
- 144 Rockingham Rd
- 4 Norman Dr Unit L
- 41 Derryfield Rd
- 3 Evergreen Way Unit End unit
- 6 Michael Ave
- 2 Mulberry St
- 24 Rockingham Rd
- 42 Kendall Pond Rd
- 13 Sunnyside Ln Unit L
- 30 Kendall Pond Rd Unit 77
- 30 Kendall Pond Rd Unit 87
Your Personal Tour Guide
Ask me questions while you tour the home.