Estimated Value: $869,000 - $902,856
3
Beds
3
Baths
2,424
Sq Ft
$368/Sq Ft
Est. Value
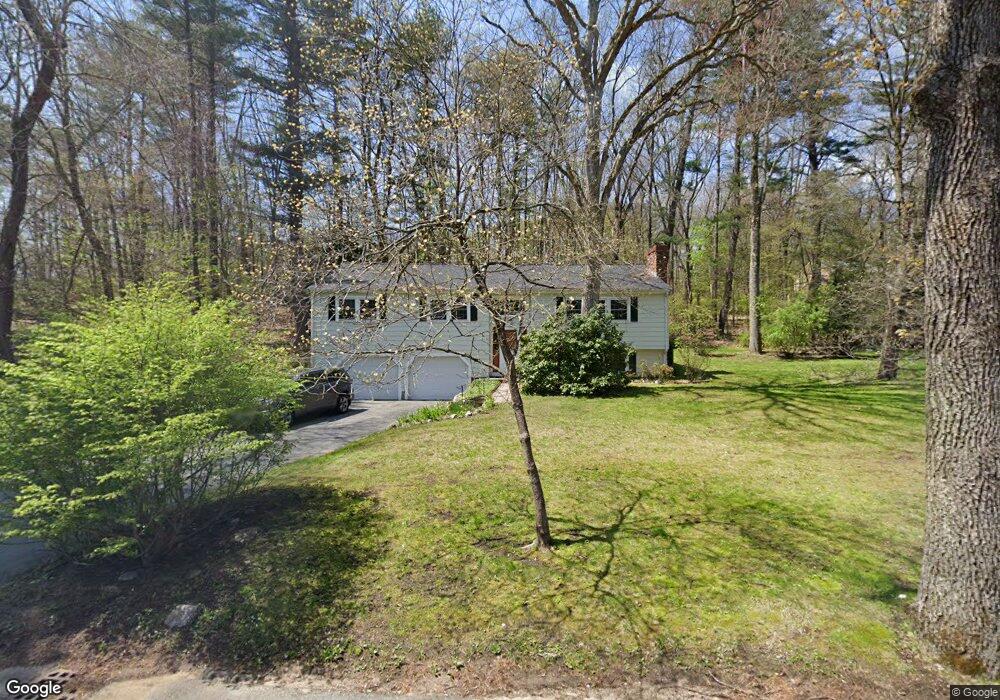
About This Home
This home is located at 5 Conant St, Acton, MA 01720 and is currently estimated at $892,714, approximately $368 per square foot. 5 Conant St is a home located in Middlesex County with nearby schools including Acton-Boxborough Regional High School, Maynard Knowledge Beginnings, and The Imago School.
Ownership History
Date
Name
Owned For
Owner Type
Purchase Details
Closed on
May 30, 2008
Sold by
Liu Yanbin and Chen Yingxue
Bought by
Sriamadhesikan Sampath and Kumar Vidya Sampath
Current Estimated Value
Home Financials for this Owner
Home Financials are based on the most recent Mortgage that was taken out on this home.
Original Mortgage
$391,800
Outstanding Balance
$249,611
Interest Rate
5.91%
Mortgage Type
Purchase Money Mortgage
Estimated Equity
$643,103
Purchase Details
Closed on
May 13, 2002
Sold by
Faber Paul W and Faber Catherine
Bought by
Chen Yingxue and Liu Yanbin
Home Financials for this Owner
Home Financials are based on the most recent Mortgage that was taken out on this home.
Original Mortgage
$300,700
Interest Rate
7.18%
Mortgage Type
Purchase Money Mortgage
Create a Home Valuation Report for This Property
The Home Valuation Report is an in-depth analysis detailing your home's value as well as a comparison with similar homes in the area
Home Values in the Area
Average Home Value in this Area
Purchase History
| Date | Buyer | Sale Price | Title Company |
|---|---|---|---|
| Sriamadhesikan Sampath | $456,800 | -- | |
| Chen Yingxue | $400,000 | -- |
Source: Public Records
Mortgage History
| Date | Status | Borrower | Loan Amount |
|---|---|---|---|
| Open | Sriamadhesikan Sampath | $391,800 | |
| Previous Owner | Chen Yingxue | $300,700 |
Source: Public Records
Tax History
| Year | Tax Paid | Tax Assessment Tax Assessment Total Assessment is a certain percentage of the fair market value that is determined by local assessors to be the total taxable value of land and additions on the property. | Land | Improvement |
|---|---|---|---|---|
| 2025 | $14,058 | $819,700 | $313,700 | $506,000 |
| 2024 | $13,248 | $794,700 | $313,700 | $481,000 |
| 2023 | $13,061 | $743,800 | $285,300 | $458,500 |
| 2022 | $12,674 | $651,600 | $248,100 | $403,500 |
| 2021 | $11,843 | $585,400 | $229,400 | $356,000 |
| 2020 | $11,263 | $585,400 | $229,400 | $356,000 |
| 2019 | $9,239 | $477,000 | $229,400 | $247,600 |
| 2018 | $8,719 | $449,900 | $229,400 | $220,500 |
| 2017 | $8,390 | $440,200 | $229,400 | $210,800 |
| 2016 | $8,130 | $422,800 | $229,400 | $193,400 |
| 2015 | $7,917 | $415,600 | $229,400 | $186,200 |
| 2014 | $7,591 | $390,300 | $229,400 | $160,900 |
Source: Public Records
Map
Nearby Homes
- 40 High St
- 30 Brewster Ln
- 63 Conant St
- 70 River St
- 1 Vanderbelt Rd
- 131 Main St
- 129 Main St Unit 129
- 25 Nylander Way
- 128 Parker St Unit 3B
- 1 Drummer Rd Unit A5
- 7 Hillcrest Dr
- 36 Brown St
- 71 Liberty St
- 31 Drummer Rd Unit 31
- 184 Main St Unit 3
- 12 Brown St
- 70 Powder Mill Rd
- 68 Powder Mill Rd
- 2 & 6 Powder Mill Rd
- 66 Powder Mill Rd
Your Personal Tour Guide
Ask me questions while you tour the home.