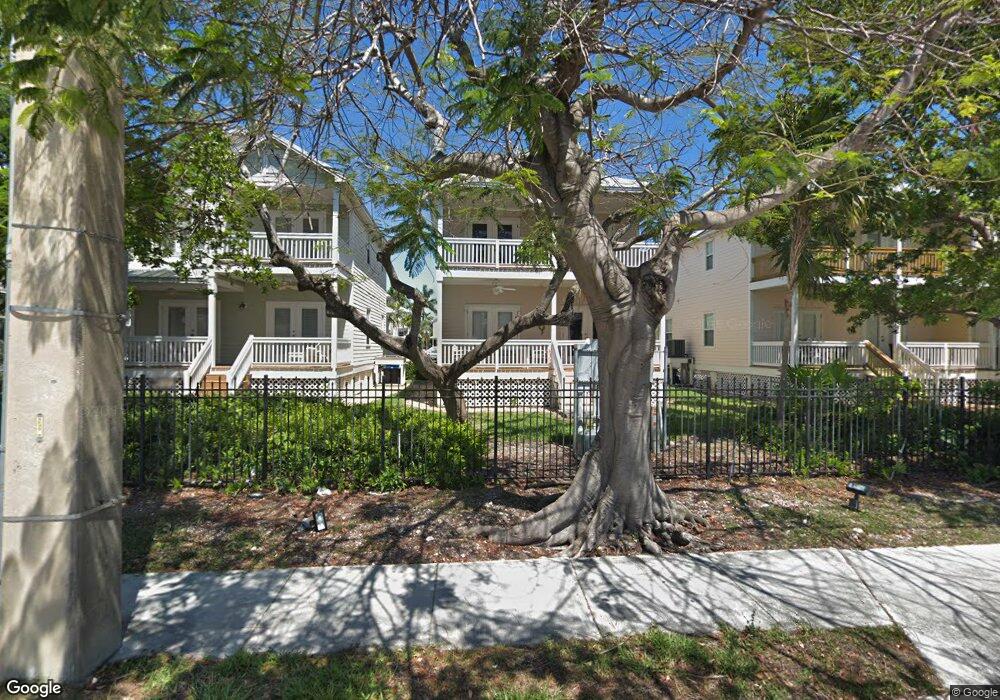
5 Coral Way Stock Island, FL 33040
Estimated Value: $807,000 - $1,280,000
2
Beds
3
Baths
1,392
Sq Ft
$724/Sq Ft
Est. Value
About This Home
This home is located at 5 Coral Way, Stock Island, FL 33040 and is currently estimated at $1,007,952, approximately $724 per square foot. 5 Coral Way is a home located in Monroe County with nearby schools including Gerald Adams Elementary School, Key West High School, and The College Of The Florida Keys Academy.
Ownership History
Date
Name
Owned For
Owner Type
Purchase Details
Closed on
Nov 28, 2010
Sold by
Ob Florida Rre Holdings Llc
Bought by
Sellers Tara L
Current Estimated Value
Home Financials for this Owner
Home Financials are based on the most recent Mortgage that was taken out on this home.
Original Mortgage
$331,381
Outstanding Balance
$207,889
Interest Rate
3.25%
Mortgage Type
FHA
Estimated Equity
$800,063
Purchase Details
Closed on
May 27, 2010
Sold by
Simons Scott A and Orion Bank
Bought by
Ob Florida Rre Holdings Llc
Purchase Details
Closed on
Apr 16, 2010
Sold by
Simons Scott A
Bought by
Orion Bank
Purchase Details
Closed on
Apr 6, 2010
Sold by
Simons Scott A
Bought by
Orion Bank
Purchase Details
Closed on
Feb 1, 2005
Sold by
Coral Hammock Llc
Bought by
Simons Scott A and Simons Stephen
Home Financials for this Owner
Home Financials are based on the most recent Mortgage that was taken out on this home.
Original Mortgage
$507,500
Interest Rate
5.72%
Mortgage Type
Purchase Money Mortgage
Create a Home Valuation Report for This Property
The Home Valuation Report is an in-depth analysis detailing your home's value as well as a comparison with similar homes in the area
Home Values in the Area
Average Home Value in this Area
Purchase History
| Date | Buyer | Sale Price | Title Company |
|---|---|---|---|
| Sellers Tara L | $340,000 | Attorney | |
| Ob Florida Rre Holdings Llc | -- | None Available | |
| Orion Bank | -- | None Available | |
| Orion Bank | -- | None Available | |
| Simons Scott A | $725,000 | -- |
Source: Public Records
Mortgage History
| Date | Status | Borrower | Loan Amount |
|---|---|---|---|
| Open | Sellers Tara L | $331,381 | |
| Previous Owner | Simons Scott A | $507,500 |
Source: Public Records
Tax History Compared to Growth
Tax History
| Year | Tax Paid | Tax Assessment Tax Assessment Total Assessment is a certain percentage of the fair market value that is determined by local assessors to be the total taxable value of land and additions on the property. | Land | Improvement |
|---|---|---|---|---|
| 2024 | $5,620 | $712,289 | $389,022 | $323,267 |
| 2023 | $5,620 | $714,687 | $407,615 | $307,072 |
| 2022 | $4,851 | $544,902 | $234,557 | $310,345 |
| 2021 | $4,603 | $459,372 | $203,665 | $255,707 |
| 2020 | $4,720 | $467,916 | $206,525 | $261,391 |
| 2019 | $4,915 | $487,315 | $223,080 | $264,235 |
| 2018 | $4,893 | $480,749 | $196,799 | $283,950 |
| 2017 | $4,400 | $424,156 | $0 | $0 |
| 2016 | $4,160 | $386,969 | $0 | $0 |
| 2015 | $3,095 | $307,477 | $0 | $0 |
| 2014 | $3,190 | $305,037 | $0 | $0 |
Source: Public Records
Map
Nearby Homes
- 55 Coral Way
- 14 Kingfisher Ln
- 5645 Macdonald Ave
- 32 Golf Club Dr
- 18 Golf Club Dr
- 58 Golf Club Dr
- 60 Golf Club Dr
- 2 Merganser Ln
- 11 Kestral Way
- 30 Whistling Duck Ln
- 8 Kestral Way
- 22 Merganser Ln
- 90 Golf Club Dr
- 45 Spoonbill Way
- 6460 Sunshine St
- 26 Spoonbill Way
- 107 Golf Club Dr
- 7000 5th St
- 7200 5th St
- 3 Spoonbill Way
- 5 Coral Way Unit 5
- 7 Coral Way
- 5 Coral Way
- 9 Coral Way
- 3 Coral Way Unit 102
- 11 Coral Way
- 11 Coral Way Unit 106
- 1 Coral Way
- 15 Coral Way
- 13 Coral Way
- 10 Coral Way Unit 144
- 6 Coral Way
- 12 Coral Way Unit 145
- 12 Coral Way
- 4 Coral Way
- 17 Coral Way
- 19 Coral Way
- 14 Coral Way
- 5671 Macdonald Ave
- 16 Coral Way