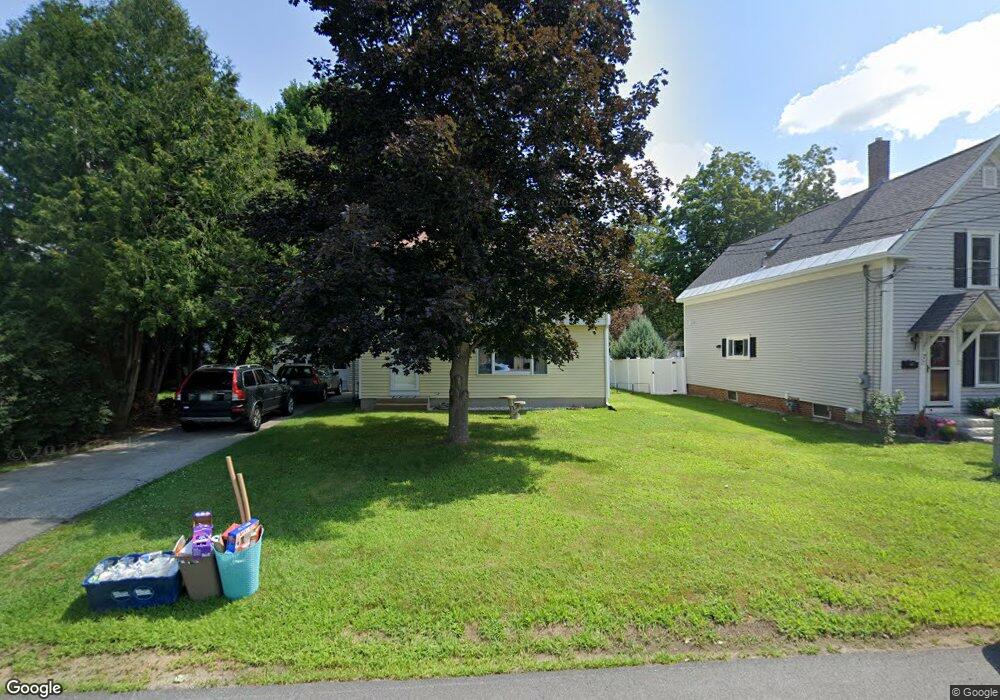
5 Cornell St Concord, NH 03301
South End NeighborhoodEstimated Value: $446,934 - $502,000
3
Beds
2
Baths
1,372
Sq Ft
$341/Sq Ft
Est. Value
About This Home
This home is located at 5 Cornell St, Concord, NH 03301 and is currently estimated at $467,234, approximately $340 per square foot. 5 Cornell St is a home located in Merrimack County with nearby schools including Abbot-Downing School, Rundlett Middle School, and Concord High School.
Ownership History
Date
Name
Owned For
Owner Type
Purchase Details
Closed on
Feb 2, 1998
Sold by
Campe Joseph A
Bought by
Dale David A and Dale Nolibeth F
Current Estimated Value
Home Financials for this Owner
Home Financials are based on the most recent Mortgage that was taken out on this home.
Original Mortgage
$99,000
Interest Rate
7.02%
Mortgage Type
VA
Create a Home Valuation Report for This Property
The Home Valuation Report is an in-depth analysis detailing your home's value as well as a comparison with similar homes in the area
Home Values in the Area
Average Home Value in this Area
Purchase History
| Date | Buyer | Sale Price | Title Company |
|---|---|---|---|
| Dale David A | $99,000 | -- |
Source: Public Records
Mortgage History
| Date | Status | Borrower | Loan Amount |
|---|---|---|---|
| Open | Dale David A | $112,213 | |
| Closed | Dale David A | $109,679 | |
| Closed | Dale David A | $99,000 |
Source: Public Records
Tax History Compared to Growth
Tax History
| Year | Tax Paid | Tax Assessment Tax Assessment Total Assessment is a certain percentage of the fair market value that is determined by local assessors to be the total taxable value of land and additions on the property. | Land | Improvement |
|---|---|---|---|---|
| 2024 | $7,989 | $288,500 | $119,500 | $169,000 |
| 2023 | $7,749 | $288,500 | $119,500 | $169,000 |
| 2022 | $7,469 | $288,500 | $119,500 | $169,000 |
| 2021 | $7,247 | $288,500 | $119,500 | $169,000 |
| 2020 | $6,966 | $260,300 | $94,100 | $166,200 |
| 2019 | $6,720 | $241,900 | $97,800 | $144,100 |
| 2018 | $6,557 | $232,600 | $98,100 | $134,500 |
| 2017 | $6,422 | $227,400 | $98,100 | $129,300 |
| 2016 | $6,115 | $221,000 | $96,300 | $124,700 |
| 2015 | $5,671 | $197,400 | $87,100 | $110,300 |
| 2014 | $5,142 | $197,400 | $87,100 | $110,300 |
| 2013 | -- | $197,400 | $87,100 | $110,300 |
| 2012 | -- | $193,000 | $87,100 | $105,900 |
Source: Public Records
Map
Nearby Homes
- 122 South St
- 12 Avon St
- 0 South St Unit 4969509
- 22 Wilson Ave
- 15 Wilson Ave
- 47 South St
- 0 Spruce St Unit 88
- 33 Spruce St
- 2 Kensington Rd
- 24 Badger St
- 1 Kensington Rd
- 105 S Main St
- 14 Downing St
- 14-16 Perley St
- 10 Perley St
- 54 Pleasant St Unit 8
- 87 S Main St Unit 2
- 4 Fayette St
- 376 S Main St
- 289 South St