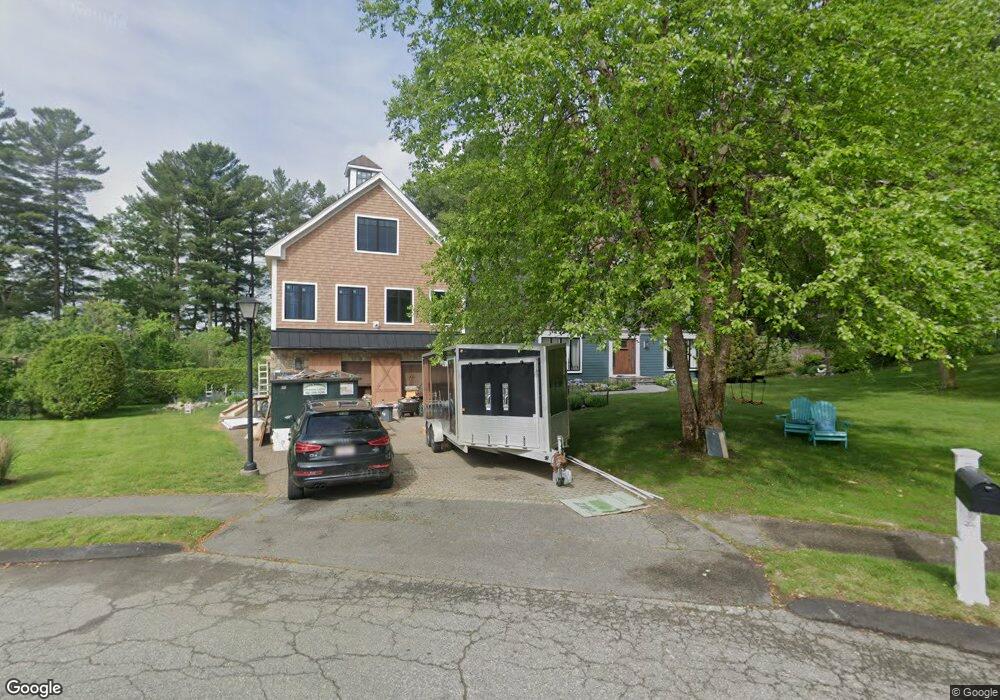
5 Cranberry Ln Lynnfield, MA 01940
Estimated Value: $1,576,055 - $2,039,000
4
Beds
4
Baths
4,000
Sq Ft
$454/Sq Ft
Est. Value
About This Home
This home is located at 5 Cranberry Ln, Lynnfield, MA 01940 and is currently estimated at $1,814,764, approximately $453 per square foot. 5 Cranberry Ln is a home located in Essex County with nearby schools including Lynnfield Middle School, Pickering Middle School, and Lynnfield High School.
Ownership History
Date
Name
Owned For
Owner Type
Purchase Details
Closed on
Nov 15, 2011
Sold by
Gattineri Rt
Bought by
Norden Jeffrey P
Current Estimated Value
Home Financials for this Owner
Home Financials are based on the most recent Mortgage that was taken out on this home.
Original Mortgage
$624,000
Outstanding Balance
$425,302
Interest Rate
4.01%
Mortgage Type
Purchase Money Mortgage
Estimated Equity
$1,389,462
Purchase Details
Closed on
Feb 11, 2004
Sold by
Gattineri Lisa S
Bought by
Gattineri Tr Lisa S
Purchase Details
Closed on
Mar 8, 1990
Sold by
Milordi Richard J
Bought by
Gattineri Anthony
Create a Home Valuation Report for This Property
The Home Valuation Report is an in-depth analysis detailing your home's value as well as a comparison with similar homes in the area
Home Values in the Area
Average Home Value in this Area
Purchase History
| Date | Buyer | Sale Price | Title Company |
|---|---|---|---|
| Norden Jeffrey P | $780,000 | -- | |
| Gattineri Tr Lisa S | -- | -- | |
| Gattineri Anthony | $390,000 | -- |
Source: Public Records
Mortgage History
| Date | Status | Borrower | Loan Amount |
|---|---|---|---|
| Open | Gattineri Anthony | $624,000 | |
| Previous Owner | Gattineri Anthony | $120,700 | |
| Previous Owner | Gattineri Anthony | $175,000 |
Source: Public Records
Tax History Compared to Growth
Tax History
| Year | Tax Paid | Tax Assessment Tax Assessment Total Assessment is a certain percentage of the fair market value that is determined by local assessors to be the total taxable value of land and additions on the property. | Land | Improvement |
|---|---|---|---|---|
| 2025 | $14,079 | $1,333,200 | $749,100 | $584,100 |
| 2024 | $12,986 | $1,235,600 | $693,600 | $542,000 |
| 2023 | $12,694 | $1,123,400 | $634,400 | $489,000 |
| 2022 | $12,634 | $1,053,700 | $634,400 | $419,300 |
| 2021 | $12,634 | $952,100 | $555,400 | $396,700 |
| 2020 | $12,560 | $902,300 | $504,800 | $397,500 |
| 2019 | $12,156 | $873,900 | $476,400 | $397,500 |
| 2018 | $12,025 | $873,900 | $476,400 | $397,500 |
| 2017 | $12,042 | $873,900 | $476,400 | $397,500 |
| 2016 | $11,707 | $807,400 | $407,300 | $400,100 |
| 2015 | $11,699 | $807,400 | $407,300 | $400,100 |
Source: Public Records
Map
Nearby Homes