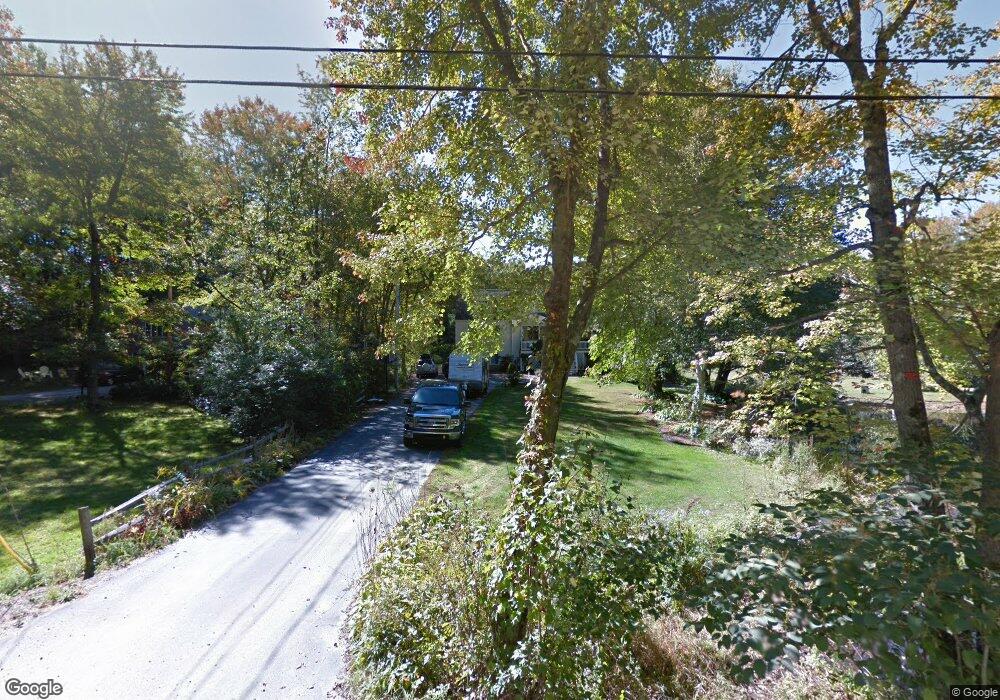
5 Currierville Rd Newton, NH 03858
Estimated Value: $436,000 - $592,000
3
Beds
1
Bath
1,632
Sq Ft
$327/Sq Ft
Est. Value
About This Home
This home is located at 5 Currierville Rd, Newton, NH 03858 and is currently estimated at $534,475, approximately $327 per square foot. 5 Currierville Rd is a home located in Rockingham County with nearby schools including Memorial School, Sanborn Regional Middle School, and Sanborn Regional High School.
Ownership History
Date
Name
Owned For
Owner Type
Purchase Details
Closed on
Feb 16, 2018
Sold by
Wilmington Svngs Fund
Bought by
Lockhart Jennifer W
Current Estimated Value
Home Financials for this Owner
Home Financials are based on the most recent Mortgage that was taken out on this home.
Original Mortgage
$212,657
Outstanding Balance
$181,564
Interest Rate
4.5%
Mortgage Type
FHA
Estimated Equity
$352,911
Purchase Details
Closed on
Jun 15, 2017
Sold by
Iannitelli Dustin M
Bought by
Wilmington Svgs Fund S
Purchase Details
Closed on
Apr 16, 2012
Sold by
Iannitelli Dustin M and Iannitelli Kristin M
Bought by
Iannitelli Kristin M
Purchase Details
Closed on
Jun 17, 1998
Sold by
Gosselin Gregoire N and Gosselin Caren L
Bought by
Iannitelli Dustin M and Iannitelli Kristin M
Home Financials for this Owner
Home Financials are based on the most recent Mortgage that was taken out on this home.
Original Mortgage
$145,195
Interest Rate
7.09%
Create a Home Valuation Report for This Property
The Home Valuation Report is an in-depth analysis detailing your home's value as well as a comparison with similar homes in the area
Home Values in the Area
Average Home Value in this Area
Purchase History
| Date | Buyer | Sale Price | Title Company |
|---|---|---|---|
| Lockhart Jennifer W | $200,000 | -- | |
| Wilmington Svgs Fund S | $235,182 | -- | |
| Iannitelli Kristin M | -- | -- | |
| Iannitelli Dustin M | $152,000 | -- |
Source: Public Records
Mortgage History
| Date | Status | Borrower | Loan Amount |
|---|---|---|---|
| Open | Lockhart Jennifer W | $212,657 | |
| Previous Owner | Iannitelli Dustin M | $145,195 |
Source: Public Records
Tax History Compared to Growth
Tax History
| Year | Tax Paid | Tax Assessment Tax Assessment Total Assessment is a certain percentage of the fair market value that is determined by local assessors to be the total taxable value of land and additions on the property. | Land | Improvement |
|---|---|---|---|---|
| 2024 | $7,816 | $308,100 | $118,100 | $190,000 |
| 2023 | $7,582 | $308,100 | $118,100 | $190,000 |
| 2022 | $6,929 | $308,100 | $118,100 | $190,000 |
| 2021 | $6,439 | $308,100 | $118,100 | $190,000 |
| 2020 | $6,439 | $308,100 | $118,100 | $190,000 |
| 2019 | $6,133 | $232,500 | $83,400 | $149,100 |
| 2018 | $5,947 | $232,500 | $83,400 | $149,100 |
| 2017 | $6,180 | $232,500 | $83,400 | $149,100 |
| 2016 | $6,082 | $232,500 | $83,400 | $149,100 |
| 2015 | $6,085 | $232,500 | $83,400 | $149,100 |
| 2014 | $6,179 | $238,200 | $83,400 | $154,800 |
| 2013 | $6,026 | $238,200 | $83,400 | $154,800 |
Source: Public Records
Map
Nearby Homes
- 43 Maple Ave
- 155 Chase Rd
- 17 Maple Ave
- 21 Currier St
- 9 Bowley Rd
- 7 Grebenstein Dr
- 142 Haverhill Rd
- 129 Haverhill Rd
- 56 Whittier St
- 152 Kimball Rd
- 7 Ashley Ln
- 7 Coopers Grove Rd
- 21 Marcoux Rd
- 40 Coopers Grove Rd
- 1 Tuxbury Ln
- 15 Maple St
- 18 Harriman Rd
- 57b New Boston Rd
- 8 Chongor Dr
- 11 & 13 Dulcies Point Rd
- 3 Currierville Rd
- 41 Maple Ave
- 37 Maple Ave
- 36 Maple Ave
- 38 Maple Ave
- 35 Maple Ave
- 157 Chase Rd
- 9 Currierville Rd
- 34 Gale Village Rd
- 13 Currierville Rd
- 30 Maple Ave
- 33 Maple Ave
- 35 Gale Village Rd
- 33 Gale Village Rd
- 31 Maple Ave
- 26 Maple Ave
- 31 Gale Village Rd
- 29 Maple Ave
- 24 Maple Ave
- 17 Currierville Rd