Estimated Value: $295,000 - $335,000
4
Beds
3
Baths
1,232
Sq Ft
$256/Sq Ft
Est. Value
About This Home
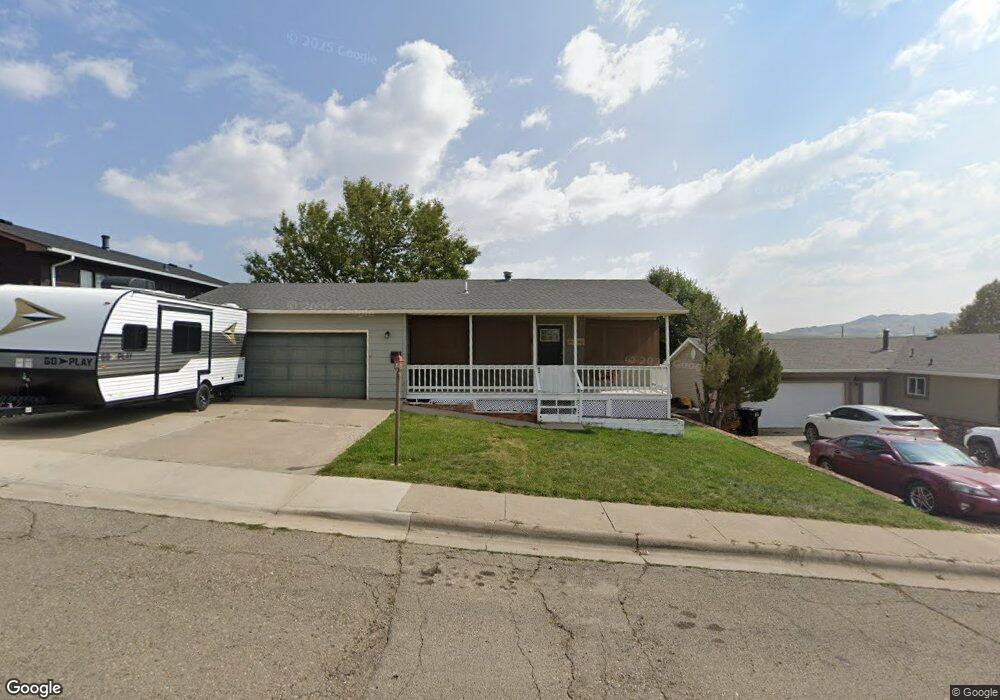
This home is located at 5 Cypress Dr, Havre, MT 59501 and is currently estimated at $315,686, approximately $256 per square foot. 5 Cypress Dr is a home located in Hill County with nearby schools including Highland Park Early Primary School, Sunnyside School, and Lincoln-McKinley School.
Ownership History
Date
Name
Owned For
Owner Type
Purchase Details
Closed on
May 1, 2015
Bought by
Vaughn Amanda J and Vaughn Derek C
Current Estimated Value
Purchase Details
Closed on
Jan 8, 2010
Sold by
Wenger Shaunda
Bought by
Wenger Shaunda R
Home Financials for this Owner
Home Financials are based on the most recent Mortgage that was taken out on this home.
Original Mortgage
$186,473
Interest Rate
4.77%
Purchase Details
Closed on
Aug 2, 2007
Sold by
Wenger Shaunda
Bought by
Ross Clay D
Create a Home Valuation Report for This Property
The Home Valuation Report is an in-depth analysis detailing your home's value as well as a comparison with similar homes in the area
Home Values in the Area
Average Home Value in this Area
Purchase History
| Date | Buyer | Sale Price | Title Company |
|---|---|---|---|
| Vaughn Amanda J | -- | -- | |
| Wenger Shaunda R | -- | -- | |
| Ross Clay D | -- | -- |
Source: Public Records
Mortgage History
| Date | Status | Borrower | Loan Amount |
|---|---|---|---|
| Previous Owner | Wenger Shaunda R | $186,473 |
Source: Public Records
Tax History Compared to Growth
Tax History
| Year | Tax Paid | Tax Assessment Tax Assessment Total Assessment is a certain percentage of the fair market value that is determined by local assessors to be the total taxable value of land and additions on the property. | Land | Improvement |
|---|---|---|---|---|
| 2025 | $2,391 | $288,700 | $0 | $0 |
| 2024 | $2,882 | $234,200 | $0 | $0 |
| 2023 | $2,809 | $251,400 | $0 | $0 |
| 2022 | $2,659 | $217,100 | $0 | $0 |
| 2021 | $2,220 | $217,100 | $0 | $0 |
| 2020 | $2,544 | $203,000 | $0 | $0 |
| 2019 | $2,549 | $203,000 | $0 | $0 |
| 2018 | $2,586 | $201,700 | $0 | $0 |
| 2017 | $2,101 | $201,700 | $0 | $0 |
| 2016 | $2,578 | $201,600 | $0 | $0 |
| 2015 | $2,379 | $201,600 | $0 | $0 |
| 2014 | $1,843 | $90,471 | $0 | $0 |
Source: Public Records
Map
Nearby Homes