5 Cypress St Concord, NH 03301
South End NeighborhoodEstimated Value: $504,000 - $561,000
2
Beds
2
Baths
1,773
Sq Ft
$297/Sq Ft
Est. Value
About This Home
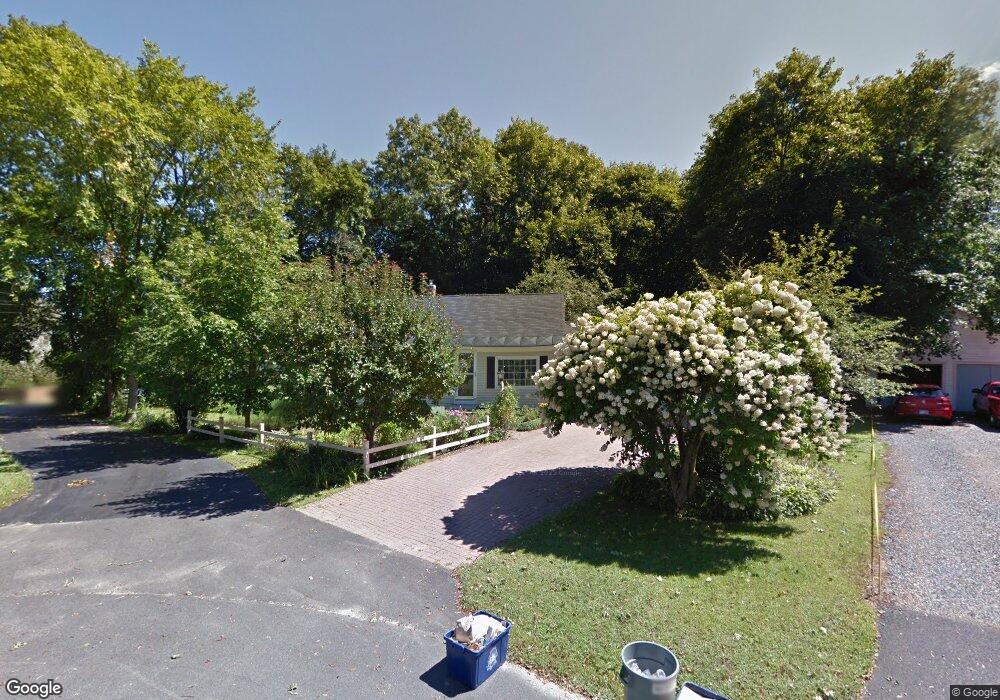
This home is located at 5 Cypress St, Concord, NH 03301 and is currently estimated at $527,393, approximately $297 per square foot. 5 Cypress St is a home located in Merrimack County with nearby schools including Abbot-Downing School, Rundlett Middle School, and Concord High School.
Ownership History
Date
Name
Owned For
Owner Type
Purchase Details
Closed on
Nov 16, 2023
Sold by
Cusson Jeanne E
Bought by
Jeanne E Cusson T E and Jeanne Cusson
Current Estimated Value
Purchase Details
Closed on
Feb 12, 2002
Sold by
Dean Thomas E and Dean Patricia C
Bought by
Cusson Jeanne E
Home Financials for this Owner
Home Financials are based on the most recent Mortgage that was taken out on this home.
Original Mortgage
$85,000
Interest Rate
7.13%
Mortgage Type
Purchase Money Mortgage
Create a Home Valuation Report for This Property
The Home Valuation Report is an in-depth analysis detailing your home's value as well as a comparison with similar homes in the area
Home Values in the Area
Average Home Value in this Area
Purchase History
| Date | Buyer | Sale Price | Title Company |
|---|---|---|---|
| Jeanne E Cusson T E | -- | None Available | |
| Cusson Jeanne E | $182,000 | -- |
Source: Public Records
Mortgage History
| Date | Status | Borrower | Loan Amount |
|---|---|---|---|
| Previous Owner | Cusson Jeanne E | $85,000 |
Source: Public Records
Tax History Compared to Growth
Tax History
| Year | Tax Paid | Tax Assessment Tax Assessment Total Assessment is a certain percentage of the fair market value that is determined by local assessors to be the total taxable value of land and additions on the property. | Land | Improvement |
|---|---|---|---|---|
| 2024 | $10,007 | $361,400 | $100,400 | $261,000 |
| 2023 | $9,713 | $361,600 | $100,400 | $261,200 |
| 2022 | $9,362 | $361,600 | $100,400 | $261,200 |
| 2021 | $9,091 | $361,900 | $100,700 | $261,200 |
| 2020 | $6,665 | $329,000 | $80,400 | $248,600 |
| 2019 | $6,381 | $300,400 | $78,900 | $221,500 |
| 2018 | $6,550 | $283,600 | $78,900 | $204,700 |
| 2017 | $7,676 | $271,800 | $78,900 | $192,900 |
| 2016 | $7,205 | $260,400 | $77,300 | $183,100 |
| 2015 | $6,797 | $234,800 | $80,700 | $154,100 |
| 2014 | $6,295 | $234,800 | $80,700 | $154,100 |
| 2013 | -- | $230,700 | $80,700 | $150,000 |
| 2012 | -- | $220,600 | $80,700 | $139,900 |
Source: Public Records
Map
Nearby Homes
- 122 South St
- 12 Avon St
- 0 South St Unit 4969509
- 0 Spruce St Unit 88
- 33 Spruce St
- 24 Pierce St
- 22 Wilson Ave
- 47 South St
- 15 Wilson Ave
- 105 S Main St
- 14 Downing St
- 14-16 Perley St
- 10 Perley St
- 87 S Main St Unit 2
- 2 Kensington Rd
- 54 Pleasant St Unit 8
- 376 S Main St
- 4 Fayette St
- 1 Kensington Rd
- 289 South St