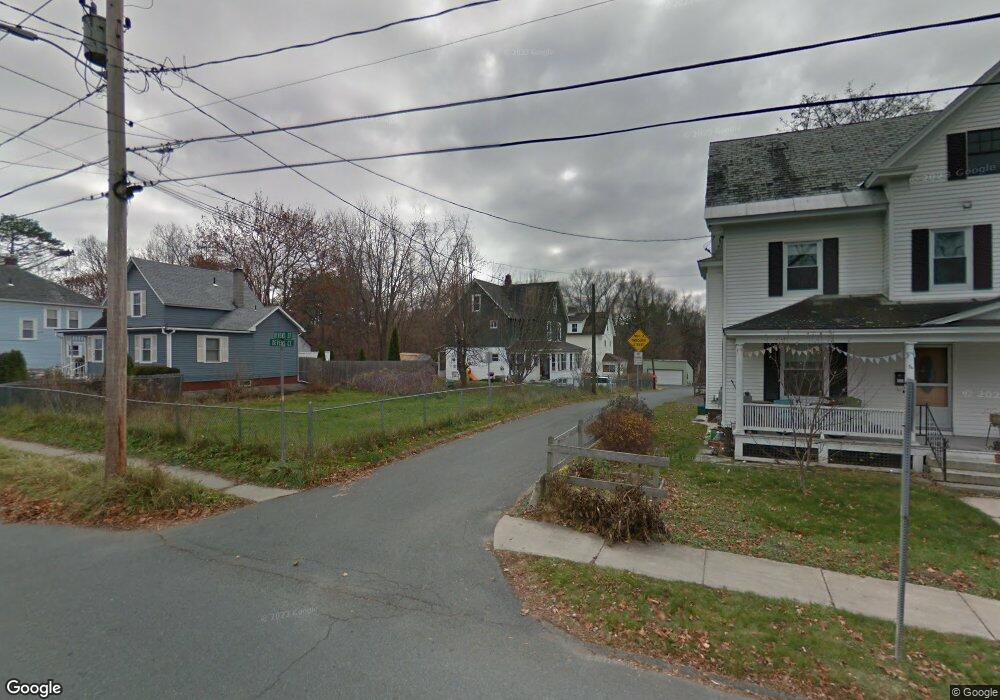
5 Devens Ct Greenfield, MA 01301
Estimated Value: $248,000 - $288,000
4
Beds
2
Baths
1,360
Sq Ft
$194/Sq Ft
Est. Value
About This Home
This home is located at 5 Devens Ct, Greenfield, MA 01301 and is currently estimated at $263,895, approximately $194 per square foot. 5 Devens Ct is a home located in Franklin County with nearby schools including Four Rivers Charter Public School and Cornerstone Christian School.
Ownership History
Date
Name
Owned For
Owner Type
Purchase Details
Closed on
Feb 21, 2007
Sold by
Sierra Adrian Torres and Arroyo Marina
Bought by
Baker David V and Baker Meguey L
Current Estimated Value
Home Financials for this Owner
Home Financials are based on the most recent Mortgage that was taken out on this home.
Original Mortgage
$126,225
Outstanding Balance
$73,578
Interest Rate
6.23%
Mortgage Type
Purchase Money Mortgage
Estimated Equity
$190,317
Purchase Details
Closed on
Apr 24, 2003
Sold by
Cassidy Ralph G
Bought by
Sierra Adrian Torres and Arroyo Marina
Home Financials for this Owner
Home Financials are based on the most recent Mortgage that was taken out on this home.
Original Mortgage
$65,000
Interest Rate
5.64%
Mortgage Type
Purchase Money Mortgage
Create a Home Valuation Report for This Property
The Home Valuation Report is an in-depth analysis detailing your home's value as well as a comparison with similar homes in the area
Home Values in the Area
Average Home Value in this Area
Purchase History
| Date | Buyer | Sale Price | Title Company |
|---|---|---|---|
| Baker David V | $148,500 | -- | |
| Baker David V | $148,500 | -- | |
| Sierra Adrian Torres | $101,500 | -- | |
| Sierra Adrian Torres | $101,500 | -- |
Source: Public Records
Mortgage History
| Date | Status | Borrower | Loan Amount |
|---|---|---|---|
| Open | Baker David V | $126,225 | |
| Closed | Sierra Adrian Torres | $126,225 | |
| Previous Owner | Sierra Adrian Torres | $65,000 |
Source: Public Records
Tax History
| Year | Tax Paid | Tax Assessment Tax Assessment Total Assessment is a certain percentage of the fair market value that is determined by local assessors to be the total taxable value of land and additions on the property. | Land | Improvement |
|---|---|---|---|---|
| 2025 | $3,695 | $188,900 | $48,800 | $140,100 |
| 2024 | $3,748 | $183,800 | $44,600 | $139,200 |
| 2023 | $3,386 | $172,300 | $44,600 | $127,700 |
| 2022 | $3,312 | $148,400 | $42,500 | $105,900 |
| 2021 | $3,265 | $140,600 | $45,700 | $94,900 |
| 2020 | $3,041 | $132,600 | $41,400 | $91,200 |
| 2019 | $2,846 | $127,300 | $36,100 | $91,200 |
| 2018 | $2,799 | $124,800 | $35,400 | $89,400 |
| 2017 | $2,638 | $121,400 | $35,400 | $86,000 |
| 2016 | $2,478 | $113,600 | $30,800 | $82,800 |
| 2015 | $2,456 | $109,100 | $31,100 | $78,000 |
| 2014 | $2,246 | $109,400 | $31,100 | $78,300 |
Source: Public Records
Map
Nearby Homes
- 11 Colrain St
- 59-61 Conway St
- 11 Conway St
- 173-175 Conway St
- 159 Chapman St
- 13 River St
- 23 Robbins Rd
- 8 Water St
- 2 Water St
- 71 Washington St
- 73 Washington St
- 77 Washington St
- 0 Marshall St
- 171 Cleveland St
- 37 Cleveland St
- 62 Peabody Ln
- 427-429 Deerfield St
- 306 Country Side Rd
- 402 Country Side Rd
- 187 Leyden Rd
Your Personal Tour Guide
Ask me questions while you tour the home.