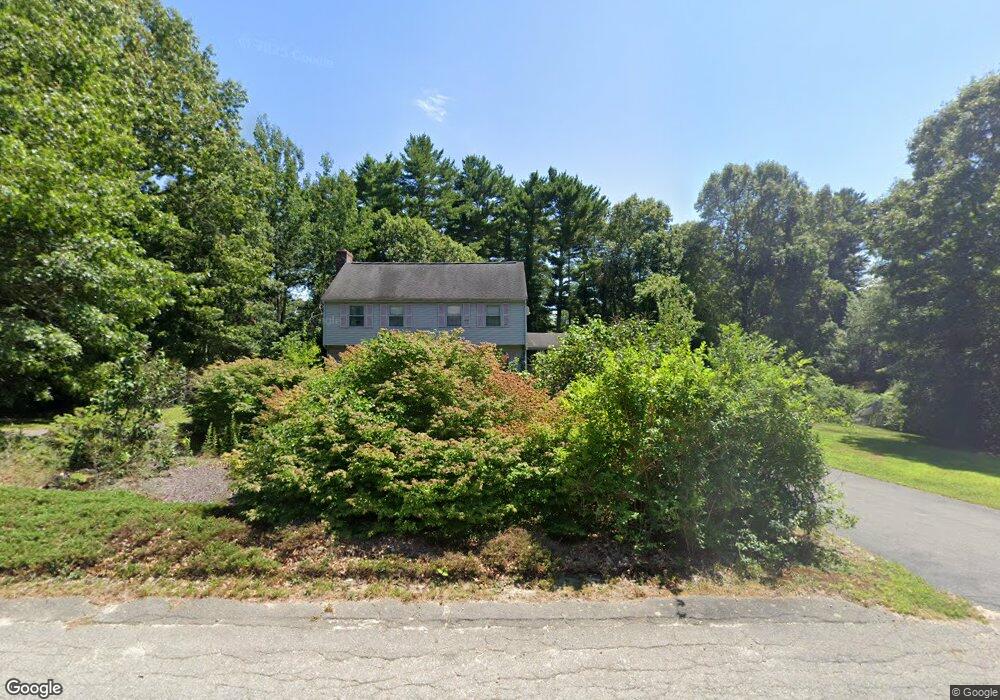
5 Dinahs Way Wareham, MA 02571
Estimated Value: $601,000 - $680,000
4
Beds
2
Baths
1,700
Sq Ft
$368/Sq Ft
Est. Value
About This Home
This home is located at 5 Dinahs Way, Wareham, MA 02571 and is currently estimated at $626,285, approximately $368 per square foot. 5 Dinahs Way is a home located in Plymouth County with nearby schools including Tabor Academy.
Ownership History
Date
Name
Owned For
Owner Type
Purchase Details
Closed on
Sep 26, 2007
Sold by
Foster Candice and Hemenway Candice L
Bought by
Svoboda Franz J and Svoboda Jane M
Current Estimated Value
Home Financials for this Owner
Home Financials are based on the most recent Mortgage that was taken out on this home.
Original Mortgage
$270,400
Outstanding Balance
$171,900
Interest Rate
6.65%
Mortgage Type
Purchase Money Mortgage
Estimated Equity
$454,385
Purchase Details
Closed on
Mar 28, 2005
Sold by
Hemenway James and Hemenway Candice L
Bought by
Hemenway Candice L
Purchase Details
Closed on
May 31, 2002
Sold by
Simpson Paul S and Simpson Natalie E
Bought by
Hemenway James W and Hemenway Candice L
Create a Home Valuation Report for This Property
The Home Valuation Report is an in-depth analysis detailing your home's value as well as a comparison with similar homes in the area
Purchase History
| Date | Buyer | Sale Price | Title Company |
|---|---|---|---|
| Svoboda Franz J | $338,000 | -- | |
| Svoboda Franz J | $338,000 | -- | |
| Hemenway Candice L | -- | -- | |
| Hemenway Candice L | -- | -- | |
| Hemenway James W | $265,000 | -- | |
| Hemenway James W | $265,000 | -- |
Source: Public Records
Mortgage History
| Date | Status | Borrower | Loan Amount |
|---|---|---|---|
| Open | Hemenway James W | $270,400 | |
| Closed | Hemenway James W | $50,700 |
Source: Public Records
Tax History
| Year | Tax Paid | Tax Assessment Tax Assessment Total Assessment is a certain percentage of the fair market value that is determined by local assessors to be the total taxable value of land and additions on the property. | Land | Improvement |
|---|---|---|---|---|
| 2025 | $5,238 | $502,700 | $139,100 | $363,600 |
| 2024 | $5,279 | $470,100 | $111,500 | $358,600 |
| 2023 | $4,687 | $417,400 | $101,500 | $315,900 |
| 2022 | $4,687 | $355,600 | $101,500 | $254,100 |
| 2021 | $4,609 | $342,700 | $101,500 | $241,200 |
| 2020 | $4,319 | $325,700 | $101,500 | $224,200 |
| 2019 | $4,087 | $307,500 | $105,000 | $202,500 |
| 2018 | $3,917 | $287,400 | $105,000 | $182,400 |
| 2017 | $3,704 | $275,400 | $105,000 | $170,400 |
| 2016 | $3,370 | $249,100 | $102,800 | $146,300 |
| 2015 | $3,256 | $249,100 | $102,800 | $146,300 |
| 2014 | $3,364 | $261,800 | $112,100 | $149,700 |
Source: Public Records
Map
Nearby Homes
- 6 Bourne Terrace
- 10 Longmeadow Dr
- 233 Marion Rd
- 7 Maud Palmer Dr
- 1 Emma Ln Unit B
- 15 14th Ave
- 437 Main St
- 19 Station St
- 17 Station St
- 9 Woodville Way
- 110 Mayflower Ridge Dr
- 4 Mather Dr
- 2645 Cranberry Hwy Unit A
- 15 Broadmarsh Ave
- 189 Pine View Terrace
- 6 Allen Ave
- 12 Oakdale St
- 20 Grant St
- 6 Wildwood Ave
- 43 Shore Ave
Your Personal Tour Guide
Ask me questions while you tour the home.