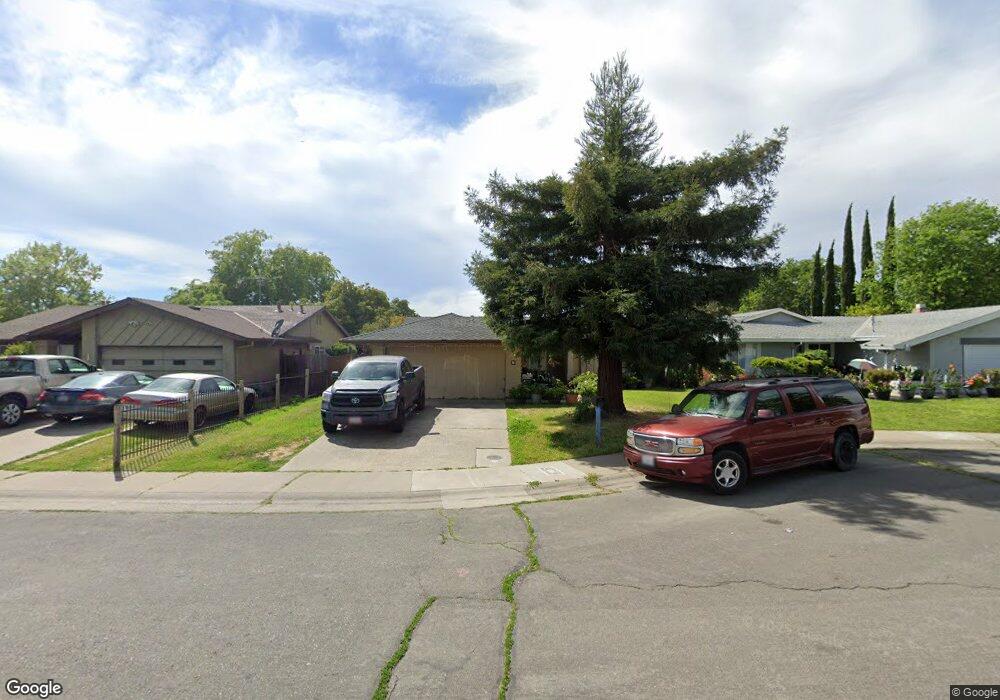
5 Doe Ct Sacramento, CA 95823
North Laguna NeighborhoodEstimated Value: $321,000 - $435,000
3
Beds
2
Baths
1,113
Sq Ft
$352/Sq Ft
Est. Value
About This Home
This home is located at 5 Doe Ct, Sacramento, CA 95823 and is currently estimated at $392,234, approximately $352 per square foot. 5 Doe Ct is a home located in Sacramento County with nearby schools including Union House Elementary School, Samuel Jackman Middle School, and Valley High School.
Ownership History
Date
Name
Owned For
Owner Type
Purchase Details
Closed on
Nov 5, 2003
Sold by
Hodgkin Richard A
Bought by
Nauvai Nafetalai F and Kolotau Lenitile
Current Estimated Value
Home Financials for this Owner
Home Financials are based on the most recent Mortgage that was taken out on this home.
Original Mortgage
$202,045
Outstanding Balance
$91,843
Interest Rate
5.72%
Mortgage Type
FHA
Estimated Equity
$300,391
Purchase Details
Closed on
Nov 2, 1995
Sold by
Associates Relocation Management Co Inc
Bought by
Hodgkin Richard A
Home Financials for this Owner
Home Financials are based on the most recent Mortgage that was taken out on this home.
Original Mortgage
$81,600
Interest Rate
7.58%
Mortgage Type
Assumption
Purchase Details
Closed on
Oct 5, 1995
Sold by
Bropleh Doeba P
Bought by
Associates Relocation Management Co Inc
Home Financials for this Owner
Home Financials are based on the most recent Mortgage that was taken out on this home.
Original Mortgage
$81,600
Interest Rate
7.58%
Mortgage Type
Assumption
Create a Home Valuation Report for This Property
The Home Valuation Report is an in-depth analysis detailing your home's value as well as a comparison with similar homes in the area
Home Values in the Area
Average Home Value in this Area
Purchase History
| Date | Buyer | Sale Price | Title Company |
|---|---|---|---|
| Nauvai Nafetalai F | $205,000 | Stewart Title | |
| Hodgkin Richard A | $80,000 | Chicago Title Co | |
| Associates Relocation Management Co Inc | $80,000 | Chicago Title Co |
Source: Public Records
Mortgage History
| Date | Status | Borrower | Loan Amount |
|---|---|---|---|
| Open | Nauvai Nafetalai F | $202,045 | |
| Previous Owner | Hodgkin Richard A | $81,600 | |
| Closed | Nauvai Nafetalai F | $14,343 |
Source: Public Records
Tax History Compared to Growth
Tax History
| Year | Tax Paid | Tax Assessment Tax Assessment Total Assessment is a certain percentage of the fair market value that is determined by local assessors to be the total taxable value of land and additions on the property. | Land | Improvement |
|---|---|---|---|---|
| 2025 | $5,085 | $291,303 | $71,078 | $220,225 |
| 2024 | $5,085 | $285,592 | $69,685 | $215,907 |
| 2023 | $5,498 | $279,993 | $68,319 | $211,674 |
| 2022 | $5,104 | $274,504 | $66,980 | $207,524 |
| 2021 | $4,096 | $269,122 | $65,667 | $203,455 |
| 2020 | $3,948 | $266,363 | $64,994 | $201,369 |
| 2019 | $3,890 | $261,141 | $63,720 | $197,421 |
| 2018 | $3,791 | $256,021 | $62,471 | $193,550 |
| 2017 | $3,716 | $251,002 | $61,247 | $189,755 |
| 2016 | $4,505 | $217,616 | $53,100 | $164,516 |
| 2015 | $3,648 | $197,833 | $48,273 | $149,560 |
| 2014 | $2,722 | $181,498 | $44,287 | $137,211 |
Source: Public Records
Map
Nearby Homes
- 240 Summer Stroll Cir
- 7843 Deer Creek Dr
- 410 Sun Shower Cir
- 7829 Acorri Walk
- 7835 Zaragoza Walk
- 7521 Sun Willow Ln
- 7839 Brizio Walk
- 192 Creekside Cir
- 7864 Monaldo Walk
- 197 Creekside Cir
- 3950 Mack Rd Unit 66
- 3950 Mack Rd Unit 182
- 3950 Mack Rd Unit 129
- 3950 Mack Rd Unit 169
- 4515 Montril Way
- 20 Lochmoor Cir
- 7895 Ann Arbor Way
- 7921 Albion Way
- 3765 Samos Way
- 4102 Weymouth Ln