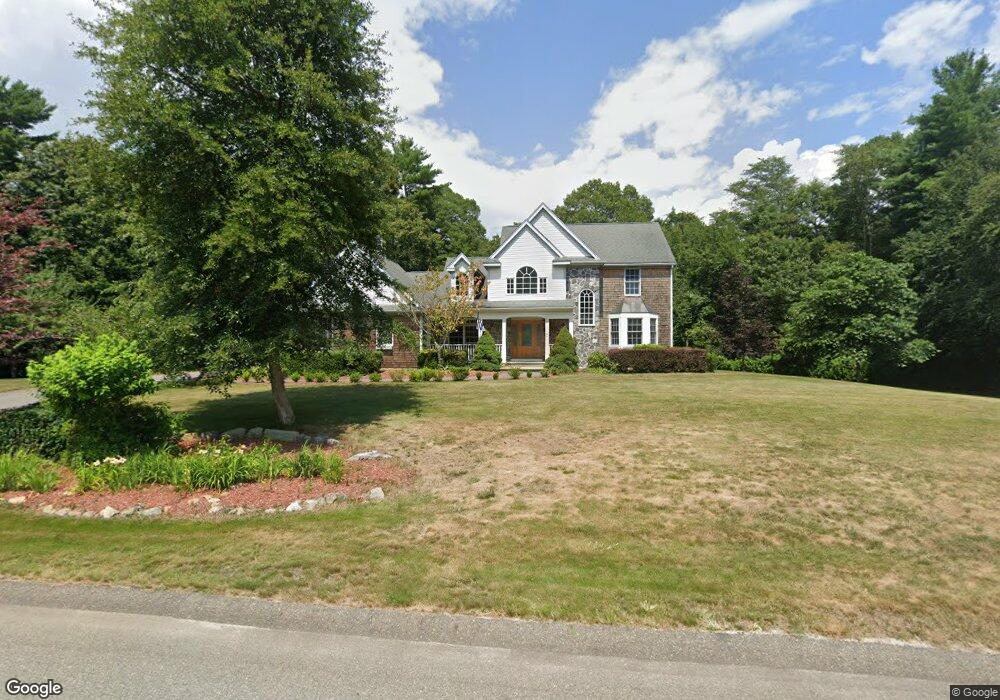
5 Donna Rd West Wareham, MA 02576
Estimated Value: $795,000 - $1,036,000
4
Beds
3
Baths
2,777
Sq Ft
$310/Sq Ft
Est. Value
About This Home
This home is located at 5 Donna Rd, West Wareham, MA 02576 and is currently estimated at $859,920, approximately $309 per square foot. 5 Donna Rd is a home located in Plymouth County.
Ownership History
Date
Name
Owned For
Owner Type
Purchase Details
Closed on
Dec 4, 2015
Sold by
Hanafin-Doonan Marybeth and Mulvaney Marybeth
Bought by
Friend Robert H
Current Estimated Value
Purchase Details
Closed on
Jun 10, 2002
Sold by
Paper Mill Rt and Cananzey Gary M
Bought by
Friend Robert H and Friend Marybeth
Home Financials for this Owner
Home Financials are based on the most recent Mortgage that was taken out on this home.
Original Mortgage
$235,000
Interest Rate
6.9%
Mortgage Type
Purchase Money Mortgage
Create a Home Valuation Report for This Property
The Home Valuation Report is an in-depth analysis detailing your home's value as well as a comparison with similar homes in the area
Home Values in the Area
Average Home Value in this Area
Purchase History
| Date | Buyer | Sale Price | Title Company |
|---|---|---|---|
| Friend Robert H | -- | -- | |
| Friend Robert H | -- | -- | |
| Friend Robert H | $135,000 | -- | |
| Friend Robert H | $135,000 | -- |
Source: Public Records
Mortgage History
| Date | Status | Borrower | Loan Amount |
|---|---|---|---|
| Previous Owner | Friend Robert H | $215,000 | |
| Previous Owner | Friend Robert H | $235,000 |
Source: Public Records
Tax History Compared to Growth
Tax History
| Year | Tax Paid | Tax Assessment Tax Assessment Total Assessment is a certain percentage of the fair market value that is determined by local assessors to be the total taxable value of land and additions on the property. | Land | Improvement |
|---|---|---|---|---|
| 2025 | $8,507 | $816,400 | $147,400 | $669,000 |
| 2024 | $8,565 | $762,700 | $118,100 | $644,600 |
| 2023 | $7,477 | $676,700 | $107,600 | $569,100 |
| 2022 | $7,477 | $567,300 | $107,600 | $459,700 |
| 2021 | $7,325 | $544,600 | $107,600 | $437,000 |
| 2020 | $6,821 | $514,400 | $107,600 | $406,800 |
| 2019 | $6,719 | $505,600 | $113,600 | $392,000 |
| 2018 | $6,372 | $467,500 | $113,600 | $353,900 |
| 2017 | $5,980 | $444,600 | $113,600 | $331,000 |
| 2016 | $5,403 | $399,300 | $114,100 | $285,200 |
| 2015 | $5,219 | $399,300 | $114,100 | $285,200 |
| 2014 | $5,321 | $414,100 | $124,100 | $290,000 |
Source: Public Records
Map
Nearby Homes