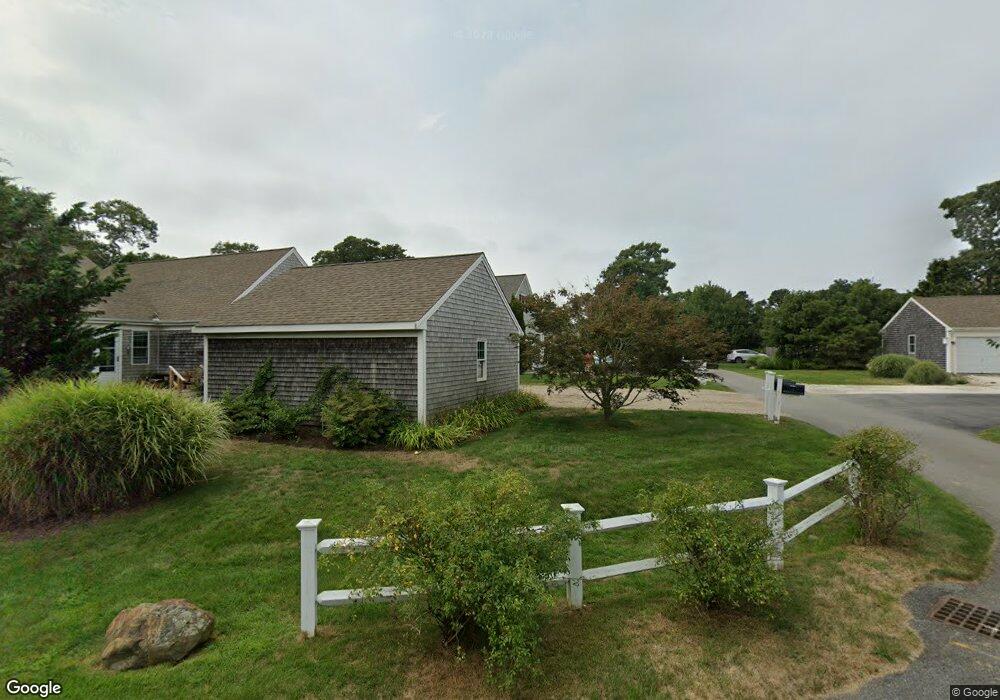
5 Dory Ln Unit 7 Eastham, MA 2642
Estimated Value: $598,997 - $728,000
1
Bed
1
Bath
883
Sq Ft
$723/Sq Ft
Est. Value
About This Home
This home is located at 5 Dory Ln Unit 7, Eastham, MA 2642 and is currently estimated at $638,749, approximately $723 per square foot. 5 Dory Ln Unit 7 is a home located in Barnstable County with nearby schools including Eastham Elementary School, Nauset Regional Middle School, and Nauset Regional High School.
Ownership History
Date
Name
Owned For
Owner Type
Purchase Details
Closed on
Sep 22, 2014
Sold by
Dednah Diane
Bought by
Moore 2Nd James
Current Estimated Value
Home Financials for this Owner
Home Financials are based on the most recent Mortgage that was taken out on this home.
Original Mortgage
$254,000
Outstanding Balance
$191,050
Interest Rate
4.14%
Mortgage Type
New Conventional
Estimated Equity
$447,699
Purchase Details
Closed on
Dec 1, 2011
Sold by
Southside Rt and Mcshane
Bought by
Dednah Diane
Create a Home Valuation Report for This Property
The Home Valuation Report is an in-depth analysis detailing your home's value as well as a comparison with similar homes in the area
Home Values in the Area
Average Home Value in this Area
Purchase History
We collect this data history from publicly available records. To have your information removed, we recommend requesting removal directly through your county’s website.
| Date | Buyer | Sale Price | Title Company |
|---|---|---|---|
| Moore 2Nd James | $317,500 | -- | |
| Moore 2Nd James | $317,500 | -- | |
| Dednah Diane | $277,000 | -- | |
| Dednah Diane | $277,000 | -- |
Source: Public Records
Mortgage History
We collect this data history from publicly available records. To have your information removed, we recommend requesting removal directly through your county’s website.
| Date | Status | Borrower | Loan Amount |
|---|---|---|---|
| Open | Moore 2Nd James | $254,000 | |
| Closed | Dednah Diane | $254,000 |
Source: Public Records
Tax History
| Year | Tax Paid | Tax Assessment Tax Assessment Total Assessment is a certain percentage of the fair market value that is determined by local assessors to be the total taxable value of land and additions on the property. | Land | Improvement |
|---|---|---|---|---|
| 2025 | $4,153 | $538,600 | $0 | $538,600 |
| 2024 | $3,084 | $440,000 | $0 | $440,000 |
| 2023 | $2,854 | $394,200 | $0 | $394,200 |
| 2022 | $2,663 | $310,400 | $0 | $310,400 |
| 2021 | $2,642 | $287,800 | $0 | $287,800 |
| 2020 | $2,515 | $288,400 | $0 | $288,400 |
| 2019 | $2,336 | $283,100 | $0 | $283,100 |
| 2018 | $2,264 | $271,100 | $0 | $271,100 |
| 2017 | $2,121 | $268,500 | $0 | $268,500 |
| 2016 | $1,791 | $240,700 | $0 | $240,700 |
| 2015 | $1,612 | $227,000 | $0 | $227,000 |
Source: Public Records
Map
Nearby Homes
Your Personal Tour Guide
Ask me questions while you tour the home.