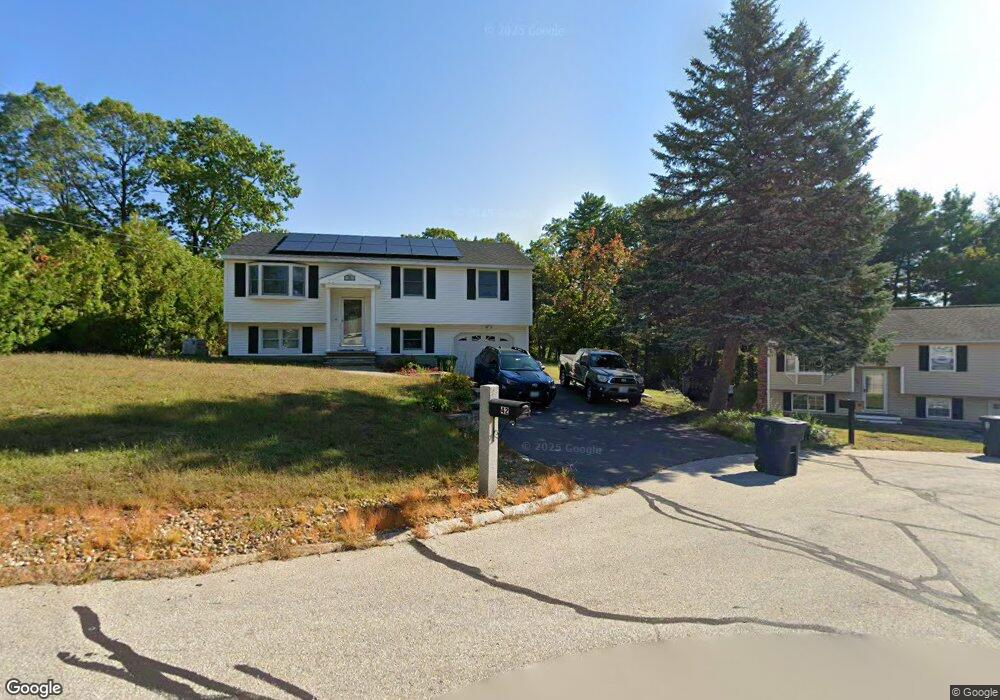
5 Dray Coach Cir Nashua, NH 03062
Southwest Nashua NeighborhoodEstimated Value: $660,814 - $695,000
3
Beds
2
Baths
2,232
Sq Ft
$304/Sq Ft
Est. Value
About This Home
This home is located at 5 Dray Coach Cir, Nashua, NH 03062 and is currently estimated at $679,204, approximately $304 per square foot. 5 Dray Coach Cir is a home located in Hillsborough County with nearby schools including Bicentennial Elementary School, Fairgrounds Middle School, and Nashua High School South.
Ownership History
Date
Name
Owned For
Owner Type
Purchase Details
Closed on
Oct 4, 2024
Sold by
Saucier Norman R
Bought by
Zhao Sherry and Hocking Anthony
Current Estimated Value
Home Financials for this Owner
Home Financials are based on the most recent Mortgage that was taken out on this home.
Original Mortgage
$440,000
Outstanding Balance
$435,045
Interest Rate
6.46%
Mortgage Type
Purchase Money Mortgage
Estimated Equity
$244,159
Purchase Details
Closed on
Feb 25, 2013
Sold by
Saucier Sharon
Bought by
Saucier Norman
Purchase Details
Closed on
Jan 16, 2004
Sold by
Dube Michael R and Dube Linda B
Bought by
Saucier Sharon L
Home Financials for this Owner
Home Financials are based on the most recent Mortgage that was taken out on this home.
Original Mortgage
$210,000
Interest Rate
5.98%
Mortgage Type
Purchase Money Mortgage
Create a Home Valuation Report for This Property
The Home Valuation Report is an in-depth analysis detailing your home's value as well as a comparison with similar homes in the area
Home Values in the Area
Average Home Value in this Area
Purchase History
| Date | Buyer | Sale Price | Title Company |
|---|---|---|---|
| Zhao Sherry | $640,000 | None Available | |
| Zhao Sherry | $640,000 | None Available | |
| Saucier Norman | -- | -- | |
| Saucier Norman | -- | -- | |
| Saucier Sharon L | $399,900 | -- | |
| Saucier Norman | -- | -- | |
| Saucier Sharon L | $399,900 | -- |
Source: Public Records
Mortgage History
| Date | Status | Borrower | Loan Amount |
|---|---|---|---|
| Open | Zhao Sherry | $440,000 | |
| Closed | Zhao Sherry | $440,000 | |
| Previous Owner | Saucier Sharon L | $225,000 | |
| Previous Owner | Saucier Sharon L | $225,000 | |
| Previous Owner | Saucier Sharon L | $210,000 |
Source: Public Records
Tax History Compared to Growth
Tax History
| Year | Tax Paid | Tax Assessment Tax Assessment Total Assessment is a certain percentage of the fair market value that is determined by local assessors to be the total taxable value of land and additions on the property. | Land | Improvement |
|---|---|---|---|---|
| 2024 | $9,149 | $575,400 | $176,900 | $398,500 |
| 2023 | $8,947 | $490,800 | $141,500 | $349,300 |
| 2022 | $8,869 | $490,800 | $141,500 | $349,300 |
| 2021 | $8,447 | $363,800 | $103,800 | $260,000 |
| 2020 | $8,311 | $367,600 | $103,800 | $263,800 |
| 2019 | $7,999 | $367,600 | $103,800 | $263,800 |
| 2018 | $7,797 | $367,600 | $103,800 | $263,800 |
| 2017 | $7,252 | $281,200 | $89,200 | $192,000 |
| 2016 | $7,050 | $281,200 | $89,200 | $192,000 |
| 2015 | $6,898 | $281,200 | $89,200 | $192,000 |
| 2014 | $6,763 | $281,200 | $89,200 | $192,000 |
Source: Public Records
Map
Nearby Homes
- 29 Dickens St
- 125 Lille Rd
- 9 Byron Dr
- 57 Wethersfield Rd
- 61 Spindlewick Dr
- 285 E Dunstable Rd
- 33 Cannon Dr
- 10 Lamb Rd
- 17 Herrick St
- 29 Greenwood Dr
- 188 Harris Rd
- 23 Glen Dr
- 15 Learned St Unit 123
- 59 Pike St
- 84 Hawthorne Village Rd Unit U414
- 31 Tenby Dr
- 6 Hayden St
- 36 Eastman St Unit 26
- 15 Westray Dr
- 51 Legacy Dr