Estimated Value: $546,000 - $616,000
2
Beds
1
Bath
1,764
Sq Ft
$329/Sq Ft
Est. Value
About This Home
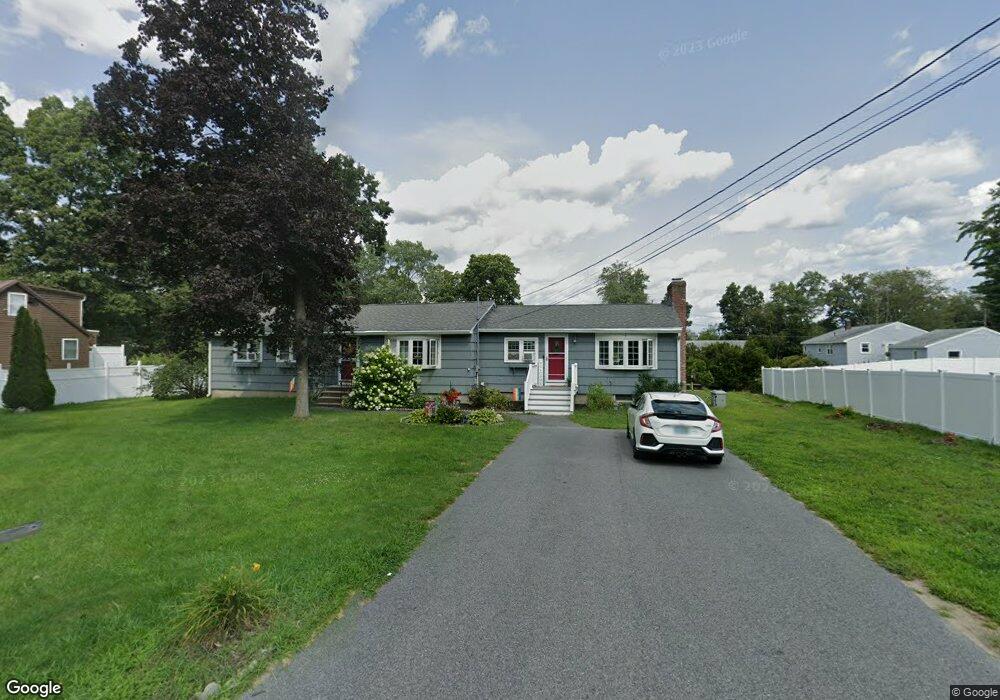
This home is located at 5 Dwight Ave, Salem, NH 03079 and is currently estimated at $579,537, approximately $328 per square foot. 5 Dwight Ave is a home located in Rockingham County with nearby schools including William E. Lancaster School, Woodbury School, and Salem High School.
Ownership History
Date
Name
Owned For
Owner Type
Purchase Details
Closed on
May 18, 2018
Sold by
Chute Robert L
Bought by
Faro Cynthia M
Current Estimated Value
Home Financials for this Owner
Home Financials are based on the most recent Mortgage that was taken out on this home.
Original Mortgage
$247,341
Outstanding Balance
$211,128
Interest Rate
4.4%
Mortgage Type
New Conventional
Estimated Equity
$368,409
Purchase Details
Closed on
Oct 5, 1973
Bought by
Chute Robert L and Chute Claire
Create a Home Valuation Report for This Property
The Home Valuation Report is an in-depth analysis detailing your home's value as well as a comparison with similar homes in the area
Purchase History
| Date | Buyer | Sale Price | Title Company |
|---|---|---|---|
| Faro Cynthia M | $255,000 | -- | |
| Chute Robert L | -- | -- |
Source: Public Records
Mortgage History
| Date | Status | Borrower | Loan Amount |
|---|---|---|---|
| Open | Faro Cynthia M | $247,341 | |
| Previous Owner | Chute Robert L | $111,588 |
Source: Public Records
Tax History
| Year | Tax Paid | Tax Assessment Tax Assessment Total Assessment is a certain percentage of the fair market value that is determined by local assessors to be the total taxable value of land and additions on the property. | Land | Improvement |
|---|---|---|---|---|
| 2024 | $7,258 | $412,400 | $155,900 | $256,500 |
| 2023 | $6,994 | $412,400 | $155,900 | $256,500 |
| 2022 | $6,619 | $412,400 | $155,900 | $256,500 |
| 2021 | $6,590 | $412,400 | $155,900 | $256,500 |
| 2020 | $5,798 | $263,300 | $111,400 | $151,900 |
| 2019 | $5,787 | $263,300 | $111,400 | $151,900 |
| 2018 | $5,690 | $263,300 | $111,400 | $151,900 |
| 2017 | $5,056 | $242,600 | $111,400 | $131,200 |
| 2016 | $4,956 | $242,600 | $111,400 | $131,200 |
| 2015 | $4,958 | $231,800 | $116,500 | $115,300 |
| 2014 | $4,819 | $231,800 | $116,500 | $115,300 |
| 2013 | $4,743 | $231,800 | $116,500 | $115,300 |
Source: Public Records
Map
Nearby Homes
- 7 Therese Rd
- 47 Millville St
- 4 Therriault Ave
- 42 Marianna Rd
- 64 Lake St
- 10 Millville St
- 12 Field Ave
- 30 Main St
- 8 Alta Ave
- 15 Briar Ave
- 144 N Policy St
- 14 Loren Rd
- 66 Brookwood Dr
- 5 Highland Ave
- 5 Canterbury Ct
- 17 Canterbury Ct
- 8 Arcadia Ln
- 10 Town Village Dr
- 75 S Policy St Unit 45
- 5 Sally Sweets Way Unit 128
Your Personal Tour Guide
Ask me questions while you tour the home.