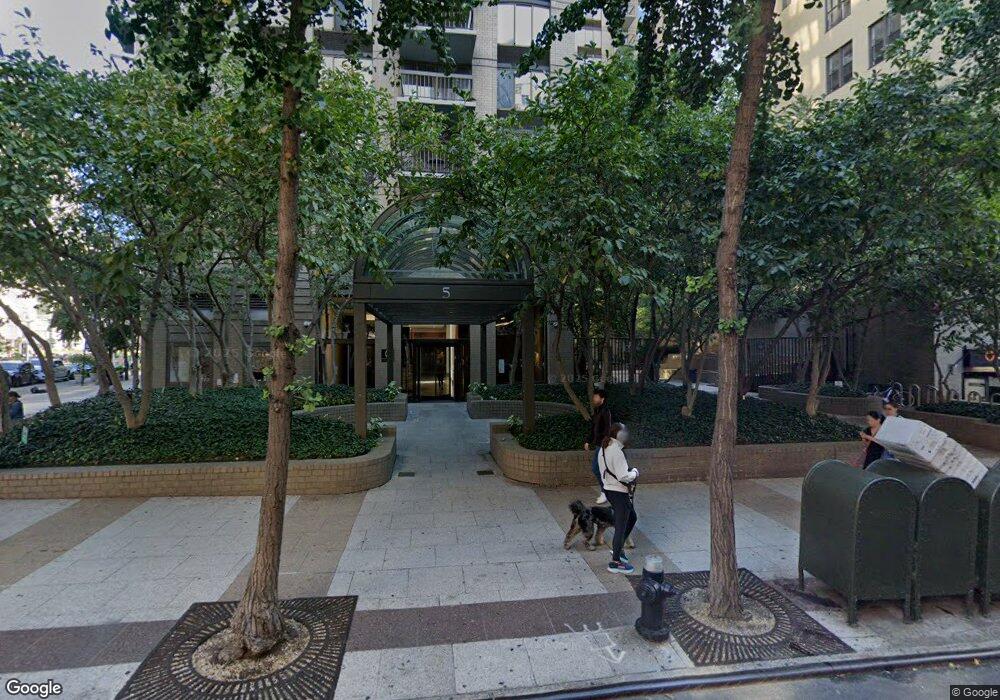
Madison Green 5 E 22nd St Unit 29S New York, NY 10010
Flatiron District NeighborhoodEstimated Value: $1,082,753 - $1,377,000
--
Bed
--
Bath
606
Sq Ft
$1,998/Sq Ft
Est. Value
About This Home
This home is located at 5 E 22nd St Unit 29S, New York, NY 10010 and is currently estimated at $1,210,938, approximately $1,998 per square foot. 5 E 22nd St Unit 29S is a home located in New York County with nearby schools including Sixth Avenue Elementary School, Simon Baruch Middle School 104, and Clinton School.
Ownership History
Date
Name
Owned For
Owner Type
Purchase Details
Closed on
Jun 8, 2010
Sold by
Regalbuto Properties Llc
Bought by
Shen Ning Nina
Current Estimated Value
Purchase Details
Closed on
Jun 30, 2009
Sold by
Segal Clary and Segal Horacio Enrique
Bought by
Regalbuto Properties Llc
Home Financials for this Owner
Home Financials are based on the most recent Mortgage that was taken out on this home.
Original Mortgage
$437,500
Interest Rate
4.93%
Mortgage Type
Purchase Money Mortgage
Purchase Details
Closed on
Aug 19, 2003
Sold by
Tang Christopher
Bought by
Segal Clary and Segal Horacio Enrique
Purchase Details
Closed on
Oct 4, 1996
Sold by
Tang Anthony C M
Bought by
Tang Christopher
Create a Home Valuation Report for This Property
The Home Valuation Report is an in-depth analysis detailing your home's value as well as a comparison with similar homes in the area
Home Values in the Area
Average Home Value in this Area
Purchase History
| Date | Buyer | Sale Price | Title Company |
|---|---|---|---|
| Shen Ning Nina | $790,000 | -- | |
| Shen Ning Nina | $790,000 | -- | |
| Regalbuto Properties Llc | $737,500 | -- | |
| Regalbuto Properties Llc | $737,500 | -- | |
| Segal Clary | $530,000 | -- | |
| Segal Clary | $530,000 | -- | |
| Tang Christopher | $200,000 | First American Title Ins Co | |
| Tang Christopher | -- | First American Title Ins Co |
Source: Public Records
Mortgage History
| Date | Status | Borrower | Loan Amount |
|---|---|---|---|
| Previous Owner | Regalbuto Properties Llc | $437,500 |
Source: Public Records
Tax History Compared to Growth
Tax History
| Year | Tax Paid | Tax Assessment Tax Assessment Total Assessment is a certain percentage of the fair market value that is determined by local assessors to be the total taxable value of land and additions on the property. | Land | Improvement |
|---|---|---|---|---|
| 2025 | $12,838 | $104,890 | $10,473 | $94,417 |
| 2024 | $12,838 | $102,686 | $10,473 | $92,213 |
| 2023 | $10,429 | $103,047 | $10,473 | $92,574 |
| 2022 | $10,299 | $103,051 | $10,473 | $92,578 |
| 2021 | $12,627 | $103,062 | $10,473 | $92,589 |
| 2020 | $10,174 | $114,098 | $10,473 | $103,625 |
| 2019 | $9,520 | $111,534 | $10,473 | $101,061 |
| 2018 | $11,269 | $105,917 | $10,473 | $95,444 |
| 2017 | $10,445 | $101,547 | $10,473 | $91,074 |
| 2016 | $10,186 | $97,270 | $10,474 | $86,796 |
| 2015 | $5,329 | $77,243 | $10,474 | $66,769 |
| 2014 | $5,329 | $75,566 | $10,473 | $65,093 |
Source: Public Records
About Madison Green
Map
Nearby Homes
- 5 E 22nd St Unit PHN
- 5 E 22nd St Unit 30A
- 11 E 22nd St Unit 7
- 21 E 22nd St Unit 2B
- 21 E 22nd St Unit 4D
- 21 E 22nd St Unit PH12F
- 175 5th Ave Unit 3NORTH
- 175 5th Ave Unit 5NORTH
- 175 5th Ave Unit 3SOUTH
- 10 E 22nd St Unit 3/4
- 23 E 22nd St Unit 32B
- 23 E 22nd St Unit 55DUPLEX
- 23 E 22nd St Unit 8A
- 45 E 22nd St Unit 42A
- 45 E 22nd St Unit 21B
- 45 E 22nd St Unit 33B
- 45 E 22nd St Unit 26A
- 45 E 22nd St Unit 37B
- 27 E 22nd St Unit 4
- 25 E 21st St Unit 2
- 5 E 22nd St Unit 4T
- 5 E 22nd St Unit 7F
- 5 E 22nd St Unit PH
- 5 E 22nd St Unit PH
- 5 E 22nd St Unit PH
- 5 E 22nd St Unit 8H
- 5 E 22nd St Unit PH
- 5 E 22nd St Unit PH
- 5 E 22nd St Unit PH
- 5 E 22nd St Unit PH
- 5 E 22nd St Unit 30T
- 5 E 22nd St Unit 29T
- 5 E 22nd St Unit 28T
- 5 E 22nd St Unit 27T
- 5 E 22nd St Unit 26T
- 5 E 22nd St Unit 25T
- 5 E 22nd St Unit 24T
- 5 E 22nd St Unit 23T
- 5 E 22nd St Unit 22T
- 5 E 22nd St Unit 21T